Variable of interest#
Hint
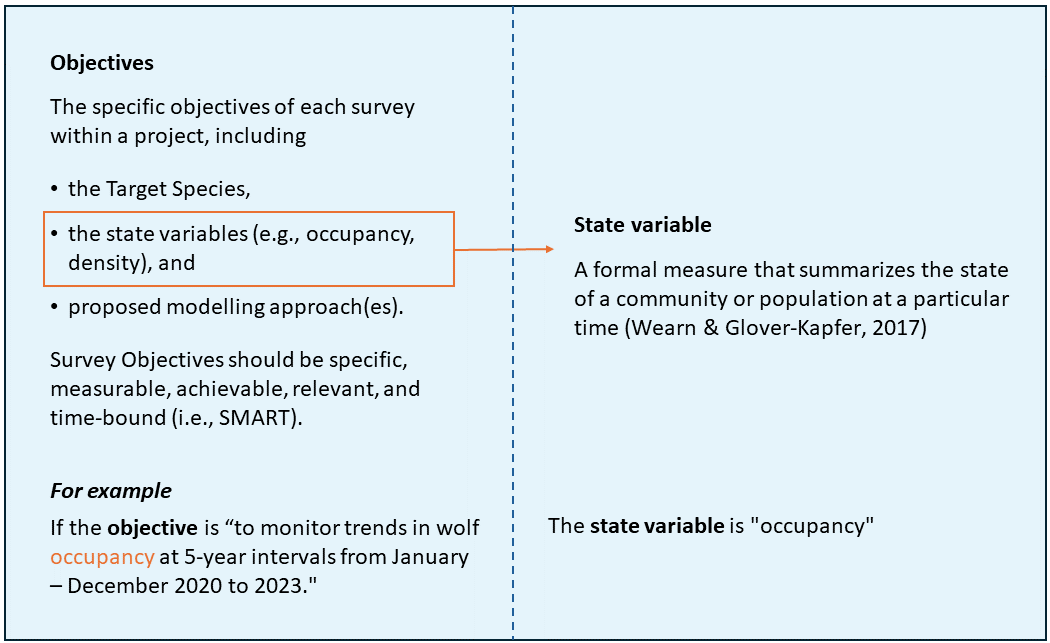
State variable: A formal measure that summarizes the state of a community or population at a particular time (Wearn & Glover-Kapfer, 2017), (e.g., species richness or population abundance).
Hover over each term to see its definition
Refer to the “overview” tab of the concept info-box for the full definition list (with figures!)
Refer to the “in-depth” tab of the concept info-box if you would like to understand more about how a “state variable” differs from an “objective.”
Definitions for each option are as follows (with a few additional notes):
Species diversity vs Richness
Note
This tool currently provides one set of recommendations for ; we hope to expand this in the future to provide recommendations more fine-tuned to Richness vs. Diversity as well as the as multiple “levels” described below.
Species richness: The total number of species in an assemblage or a sample’ (Gotelli & Chao, 2013).
Examples of possible questions include:
How many different species occur in the study area?
How does the number of species in the study area during the year?
How many different species live in forest ‘A’ compared to forest ‘B’?
What factors affect the number of species that live in the study area?
Species diversity: A measure of diversity that incorporates both the number of species in an assemblage and some measure of their relative abundances.’ (Gotelli & Chao, 2013)
Examples of possible questions include:
What happens to the diversity of species in a forest when it is cut down for development?
How do human activities (such as farming) impact the balance of species in a meadow?
Does the diversity of species in the study area decrease when pesticides are used, and are some species more impacted than others?
Note that there are multiple “levels” to Species diversity & richness, these include:
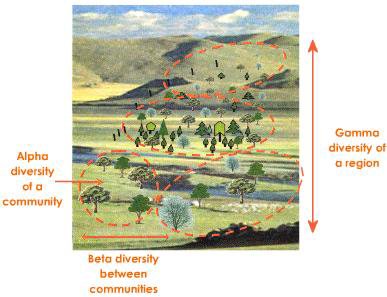
Alpha richness (α): The number of species at the level of an individual camera location (Wearn & Glover-Kapfer, 2017).
Beta-diversity (β): The differences between the communities or, more formally, the variance among the communities (Wearn & Glover-Kapfer, 2017).
Gamma richness (γ): The number of species across a whole study area (Wearn & Glover-Kapfer, 2017).
Species inventory (presence) vs. Occupancy
Species inventory: Rapid assessment surveys used to determine what species are present in a given area at a given point in time; there is no attempt made to quantify aspects of communities or populations (Wearn & Glover-Kapfer, 2017).
Occupancy: The probability a site is occupied by the species (Mackenzie et al., 2002).
Examples of possible questions include:
Is the species there?
Are deer present in this forest during the winter?
Is the endangered butterfly species present in this park?
Do wolves appear in the northern region of the country?
Examples of possible questions include:
Is the species living or actively using an area?
Is the species more likely to occupy habitat A or habitat B?
How often do bears occupy different areas of the forest throughout the year?
Do different types of birds occupy the same tree species in the forest?
How does the availability of food affect the occupancy of wolves in a specific area?
Absolute abundance vs. Relative abundance vs. Density
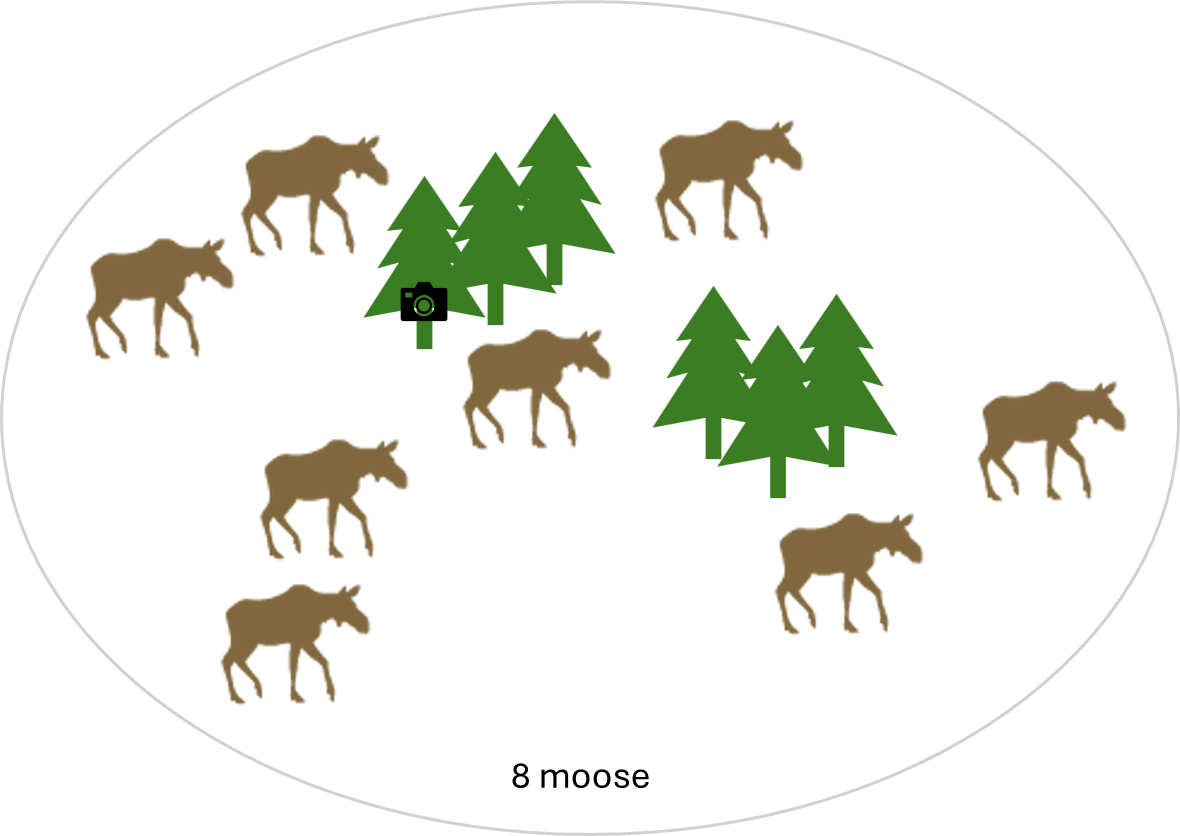
Absolute abundance / Population size: The number of individuals in a population (Wearn & Glover-Kapfer, 2017).
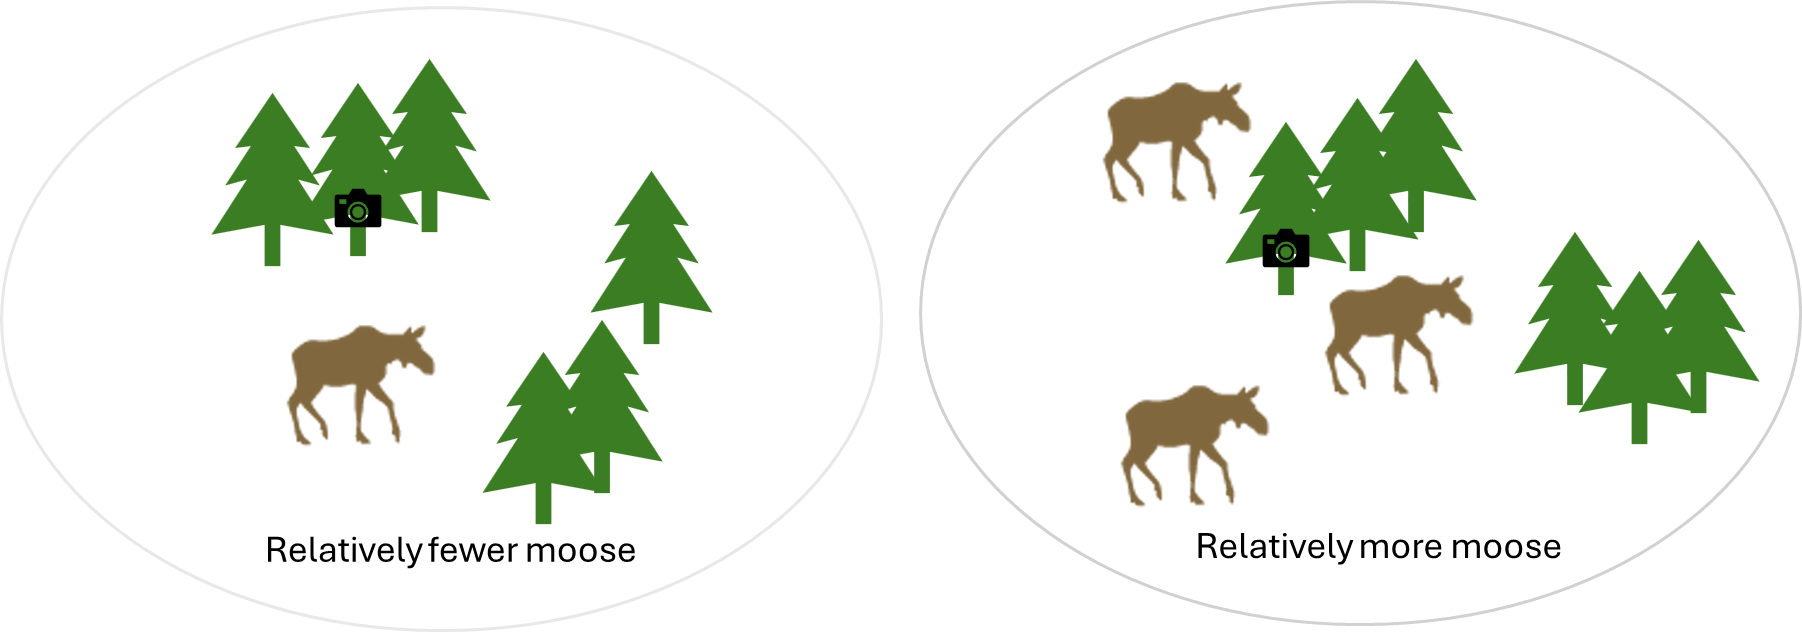
Relative abundance: The number of animals detected from one camera/area compared to another camera/area.
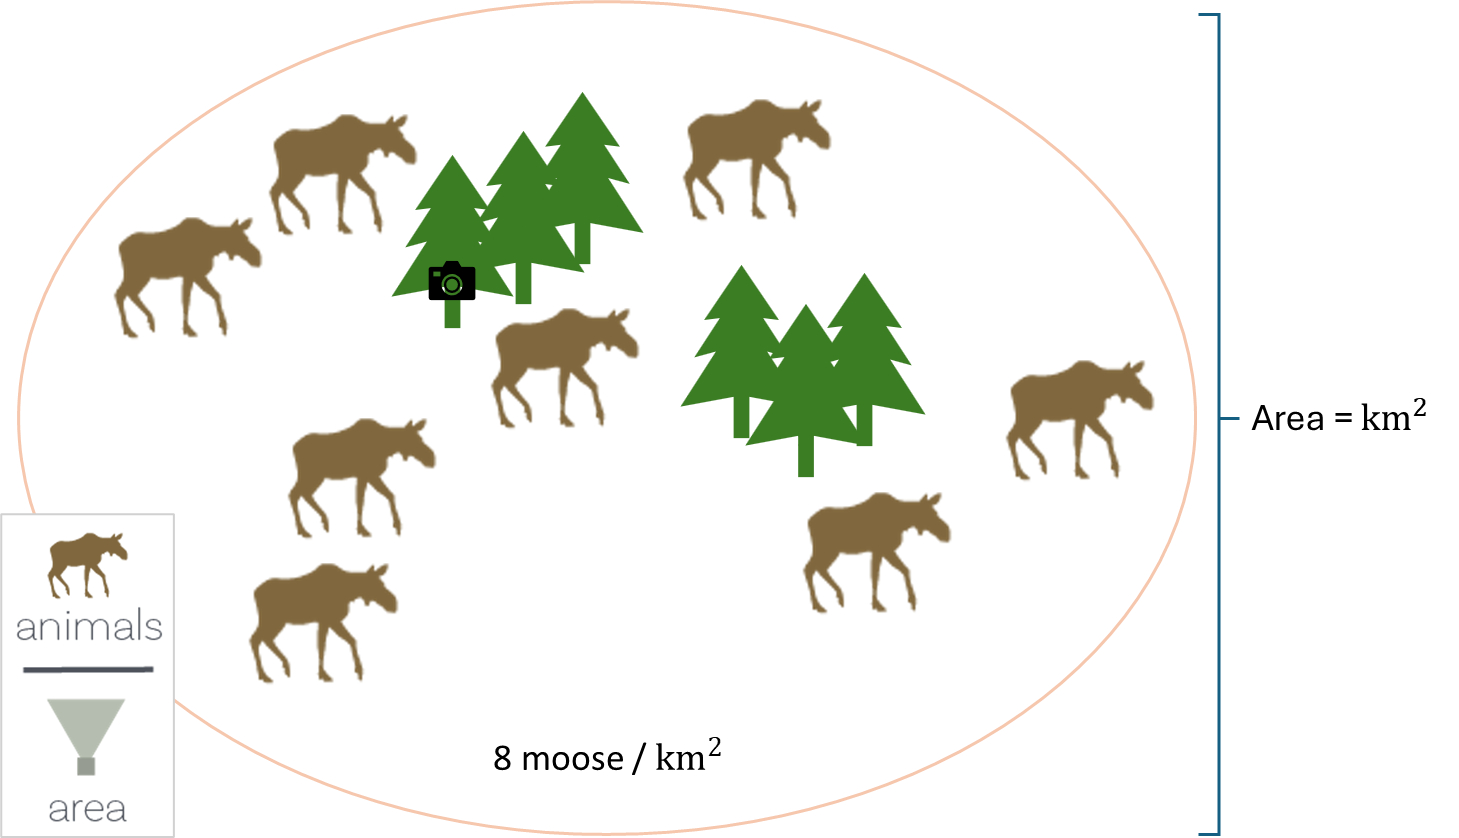
Density: The number of individuals per unit area (Wearn & Glover-Kapfer, 2017)
Examples of possible questions include:
How many animals were there?
How have moose numbers changed over time?
Examples of possible questions include:
Do moose spend more time in wetlands than dense forests? Does this change in summer vs winter?
Do moose spend less time near roads?
Examples of possible questions include:
How many animals were there per km2?
Vital rates
Vital rate: The species-specific factors of a population that, together, play a large role in the population’s trend. These include the birth rate, recruitment rate, and probability of survival and mortality.’ (NBCKC, 2024a)
Such as:
Birth rate: ‘The average number of offspring produced per individual per unit time.’ (NBCKC / CNSCB, 2024)
Recruitment rate: is the process by which new individuals are added to an existing population, whether by birth and maturation or by immigration. Recruitment rate is really a measure of how many individuals are added to the reproductive pool; individuals are considered to have been recruited once they’ve reached a certain age (), and this age is generally related to when they begin to reproduce. (modified from NBCKC / CNSCB, 2024)
Population growth rate: The rate of population growth over time. Used as a short-term estimator of growth trend. May also be refferred to as ‘The rate of population change’. The rate of population change (increase or decrease) can be estimated, for example, from two or more population estimates (or relative abundance indices) over time.’ (NBCKC / CNSCB, 2024)
Examples of possible questions include:
Does a certain disturbance result in a lower birth rate of deer?
Are fewer individuals surviving to adulthood in area ‘A’ vs area ‘B’?
Is the population in area ‘A’ growing faster than in area ‘B’?
Behaviour
Behaviour: behaviour focused objectives vary greatly; they may be qualitative or quantitative (e.g., diel activity patterns, mating, boldness, predation, foraging, activity patterns, vigilance, parental care (Caravaggi et al., 2020; Wearn & Glover-Kapfer, 2017).
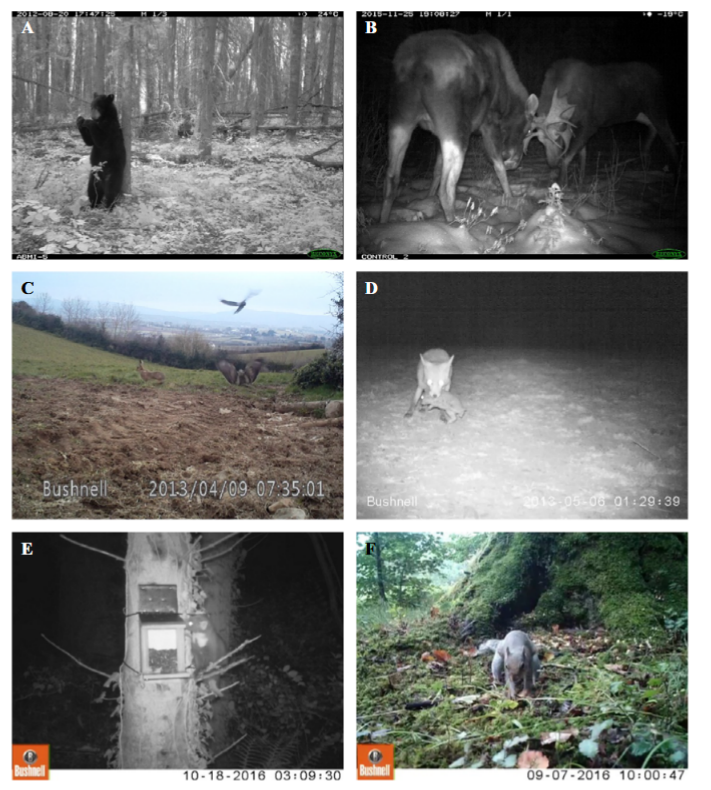
Caravaggi et al. (2017) - Fig. 1. Examples of animal behaviour captured by camera traps:
(A) Scent marking by an American black bear (Ursus americanus); (B) intraspecific competition in moose (Alces alces); (C) interspecific interactions between a European hare (Lepus europaeus; anti-predator response), a common buzzard (Buteo buteo; avoidance and attempted predation) and a hooded crow (Corvus cornix; anti-predator behaviour) captured on video (available at 10.6084/m9.figshare.4508369); (D) predation of a European rabbit (Oryctolagus cuniculus) by a red fox (Vulpes vulpes); (E) investigation of a squirrel feeding station by a pine marten (Martes martes); (F) nut caching by a grey squirrel (Sciurus carolinensis). Images provided by A.C. Burton (a, b), A. Caravaggi (c, d) and C.M.V. Finlay (e, f).
Examples of possible questions include:
Are animals more active at night in areas with high human activity?
Are animals closer to disturbance less likely to display anti-predator behaviour?
Is foraging behaviour impacted by disturbance?
Objective vs. State Variable
One of the first choices you will make when designing your study, is what it is that you plan to measure (or your “state variable”; a formal measure that summarizes the state of a community or population at a particular time [Wearn & Glover-Kapfer, 2017]). Since this concept might be easy to confuse with Survey Objective (they are often referred to interchangeably), consider the following figure:
What should objectives include?
To expand upon the figure above, Survey Objective should be specific, measurable, achievable, relevant and time-bound (i.e., SMART). Survey Objective should describe the following:
Target Species - the species that the survey is designed to detect,
State variable - a formal measure that summarizes the state of a community or population at a particular time (Wearn & Glover-Kapfer, 2017) (e.g., species richness or population abundance), and
Proposed modelling approach - the method used to analyze the camera data, which should depend on the state variable (e.g., [MacKenzie et al., 2002], [e.g., ] for density estimation, etc.) and the Target Species.
An example of a clearly defined Survey Objective could be “to monitor trends in wolverine occupancy at 5-year intervals from March – December 2020 to 2030 in wildlife management unit 539”.
The Survey Objective will determine the appropriate study design and deployment considerations (e.g., camera spacing, survey effort, attractants or not). For example, based on the above objective for our wolverine occupancy project, we “randomly selected within a 15 km x 15 km grid cell with one camera per location and a total of 60 stations across our study area. We will place lure dispensers at each to increase the likelihood of detecting a wolverine.” to increase the likelihood of detecting a wolverine.”
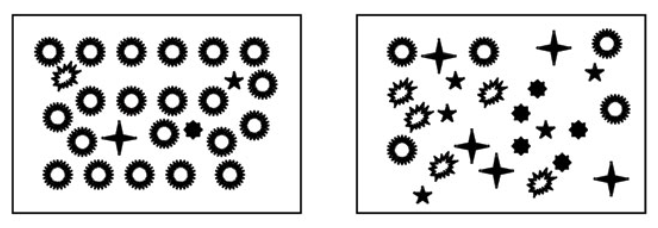
Pyron (2010) - Fig. 1 Species evenness and species richness for animalcule communities. Both communities contain five species of animalcules. Species richness is the same. The community on the left is dominated by one of the species. The community on the right has equal proportions of each species. Evenness is higher when species are present in similar proportions. Thus the community on the left has higher species diversity, because evenness is higher.
Note that there are multiple “levels” to Species diversity & richness, these include:
Alpha richness (α): The number of species at the level of an individual camera location (Wearn & Glover-Kapfer, 2017).
Beta-diversity (β): The differences between the communities or, more formally, the variance among the communities (Wearn & Glover-Kapfer, 2017).
Gamma richness (γ): The number of species across a whole study area (Wearn & Glover-Kapfer, 2017).
Absolute abundance: The number of individuals in a population (Wearn & Glover-Kapfer, 2017).
Relative abundance: The number of animals detected from one camera/area compared to another camera/area.
Density: The number of individuals per unit area (Wearn & Glover-Kapfer, 2017)

Behaviour: behaviour focused objectives vary greatly; they may be qualitative or quantitative (e.g., diel activity patterns, mating, boldness, predation, foraging, activity patterns, vigilance, parental care (Caravaggi et al., 2020; Wearn & Glover-Kapfer, 2017).
Caravaggi et al. (2017) - Fig. 1 Examples of animal behaviour captured by camera traps:
(A) Scent marking by an American black bear (Ursus americanus); (B) intraspecific competition in moose (Alces alces); (C) interspecific interactions between a European hare (Lepus europaeus; anti-predator response), a common buzzard (Buteo buteo; avoidance and attempted predation) and a hooded crow (Corvus cornix; anti-predator behaviour) captured on video (available at 10.6084/m9.figshare.4508369); (D) predation of a European rabbit (Oryctolagus cuniculus) by a red fox (Vulpes vulpes); (E) investigation of a squirrel feeding station by a pine marten (Martes martes); (F) nut caching by a grey squirrel (Sciurus carolinensis). Images provided by A.C. Burton (a, b), A. Caravaggi (c, d) and C.M.V. Finlay (e, f).
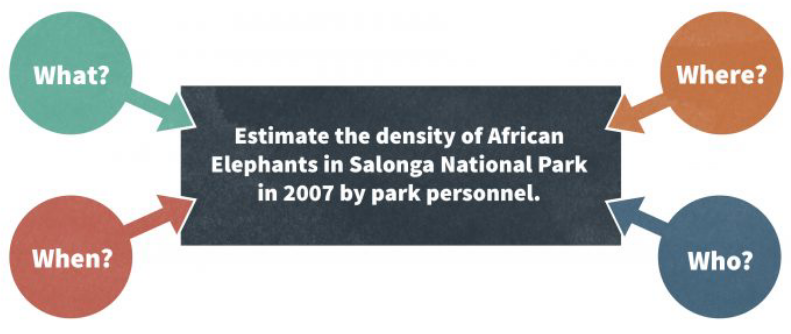
McComb et al. (2010) - Fig 4.3: The components of a monitoring objective.