Species rarity#
Hint
Species rarity: the number of individuals present of the species in question, relative to the total number of individuals of all species (or how ‘represented’ is the species when considering the total number of individuals of all species). While technically “how rare” a species is will be change from place to place (e.g., will depend on geographic range, habitat specificity, local abundance, etc.; Crisfield et al., 2024), for the purposes of informing study design recommendations, the species rarity categories are defined as follows:
: Probability of occupancy > ~0.75-0.8 (> 0.75 [Kinnaird & O’Brien, 2012; Kays et al., 2020]; > 0.8 [Shannon et al., 2014; Wearn & Glover-Kapfer, 2017]
Less common: Probability of occupancy ~0.25-0.75
Rare: Probability of occupancy < 0.25 Kays et al., 2020
Very rare: Probability of occupancy < 0.001 (Wearn & Glover-Kapfer, 2017; Rowcliffe et al., 2008; O’Brien, 2010)
Unknown: Select this option if you’re not sure of the rarity of your Target Species (single or multiple species)
Multiple: Select this option if your study includes multiple Target Species that vary in rarity.
Probability of occupancy: the expected probability that a given camera site is occupied, for a given species (Kays et al., 2020)
Refer to the tabs below for more information.
Generally, species rarity can be thought of as the probability that the species occupies the site, for a given species (or study area, depending on the scale of interest) Kays et al., 2020.
Note
Species rarity can be generally thought of as a species characteristic, however, “not in the same sense that hair colour or wing venation… it’ an emergent trait of a species’ population and its environment rather than a trait of an individual organism” Kunin, 1997
How does this relate to study design?
Species rarity can influence the ideal camera arrangement. For example, when monitoring rare or cryptic species that are unlikely to be detected with other designs, it may be appropriate to use a where cameras are placed in areas that are known or suspected to have higher activity levels (e.g., game trails, mineral licks, etc.).
Species rarity can also influence the ideal number of cameras and survey length (Chatterjee et al., 2021). Low detection probability of rare or cryptic species can result in imprecise estimates if there are too few cameras or if cameras are not deployed for long enough (e.g., Steenweg et al., 2019)). Chatterjee et al. (2021) suggested that for occupancy models (MacKenzie et al., 2002) of common species, to survey a minimum of 50 sites for 15–20 days. For rare, elusive species, they recommended surveying 100 sites at a minimum for 20–30 days (Chatterjee et al., 2021).
Species rarity can influence the appropriate modelling approach. For measures of species richness or diversity, it is presumed that a camera is active long enough to detect rare species that may occur at a specific location (Wearn & Glover-Kapfer, 2017). If this is not the case, the results will indicate that the species was not present when it was (i.e., a “false negative”).
This section will be available soon! In the meantime, check out the information in the other tabs!

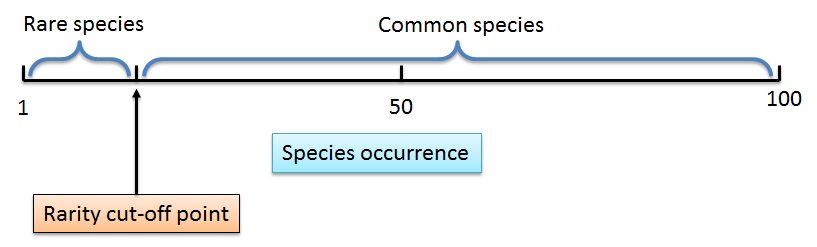
Leroy (2024) The rarity cut-off point is here defined as the threshold of occurrence below which species are considered rare.
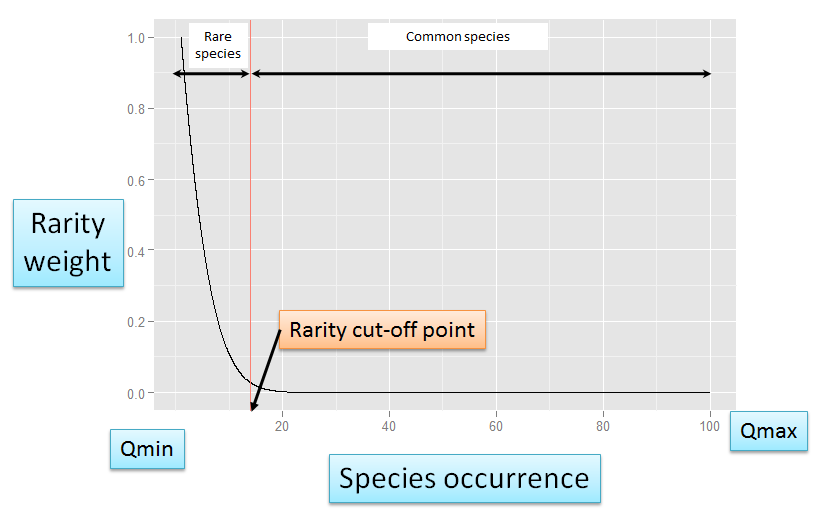
Leroy (2024) Weight assignation curve adjusted to an arbitrary rarity cut-off.

Species accumulation and rarefaction curves
Generating a rarefaction curve from collector’s curves in R within the tidyverse (CC198)
Type |
Name |
Note |
URL |
Reference |
|---|---|---|---|---|
R package |
Package ‘Rarity’: Calculation of Rarity Indices for Species and Assemblages of Species |
Allows calculation of rarity weights for species and indices of rarity for assemblages of species according to different methods (Leroy et al. 2012, Insect. Conserv. Divers. 5:159-168 doi:10.1111/j.1752-4598.2011.00148.x; Leroy et al. 2013, Divers. Distrib. 19:794-803 doi:10.1111/ddi.12040). |
Leroy, B. (2023). Package ‘Rarity’: Calculation of Rarity Indices for Species and Assemblages of Species. R package version 1.3-8, https://cran.r-project.org/web/packages/Rarity/ |
|
Online resource |
Rarity Indices |
Brief, understandable explanation of rarity indices |
Leroy, B. (2024). Rarity Indices. https://borisleroy.com/en/research/rarity-indices/ |
|