Occupancy models#
Assumptions, Pros, Cons
is constant (MacKenzie et al., 2002) (abundance is constant) (MacKenzie et al., 2006)
Camera locations are independent (MacKenzie et al., 2006)
The probability of and detection are constant across all camera locations within a stratum or can be modelled using covariates (MacKenzie et al., 2006)
Species are not misidentified (MacKenzie et al., 2006)
Does not require individual identification (MacKenzie et al., 2006)
Only requires detection*/non-detection data for each site (Wearn & Glover-Kapfer, 2017)
Relatively easy-to-use software exists for fitting models (PRESENCE, MARK, and the ‘unmarked’ R package) (Wearn & Glover-Kapfer, 2017)
Open models exist that allow for the estimation of site colonization and extinction rates (MacKenzie et al., 2006; Wearn & Glover-Kapfer, 2017)
Multi-species occupancy models (MacKenzie et al., 2002) allow the inclusion of interactions among species while controlling for imperfect detection (Wearn & Glover-Kapfer, 2017)
(MacKenzie et al., 2002) only measures distribution; it may be a misleading indicator of changes in abundance (Wearn & Glover-Kapfer, 2017)
Interpretation/communication of results may not be straightforward (if the scale of movement is much larger than the camera spacing the results should be interpreted as ‘probability of use’ rather than ) (Wearn & Glover-Kapfer, 2017)
This section will be available soon! In the meantime, check out the information in the other tabs!

Note
This content was adapted from: The Density Handbook, “Using Camera Traps to Estimate Medium and Large Mammal Density: Comparison of Methods and Recommendations for Wildlife Managers” (Clarke et al., 2023)
Occupancy models describe spatial patterns of animal occurrence (Sollmann et al., 2018) and have been proposed as a proxy for abundance (Noon et al., 2012). They ask: what proportion of a study area is inhabited by a population – that is, at how many camera sites do one or more individuals of a species occur (MacKenzie et al., 2017)? The basic equation for occupancy is:
where 𝜓 is the probability a site is occupied, 𝑥̂ is the estimated number of occupied sites (i.e., the count of sites where animals were detected, corrected for detection probability) and 𝑠 is the total number of sites surveyed (MacKenzie et al., 2017). Unlike simple measures of presence-absence, occupancy models account for imperfect detection (Sollmann et al., 2018). They attempt to differentiate between absence – animals truly not present – and nondetection – animals present but not detected – by repeatedly sampling sites over time. The central assumption of basic occupancy models is that repeated samples occur during a period in which the site is closed to changes in occupancy (i.e., occupancy status – present or absent – does not change during the sampling period). Thus if a species is detected during one of three sampling occasions, it is assumed that it was present during all three occasions but undetected during two.
In theory, occupancy and abundance share a predictable relationship. As population size increases, the number of sites occupied by members of that population should also increase (until all sites are occupied); likewise, a decrease in population size should lead to a decrease in the number of sites used (Gaston et al., 2000; Royle & Dorazio, 2008). This is called an occupancy-abundance relationship, and – because of it – occupancy can be used as an index of abundance.
Advantages of occupancy as an index of abundance include:
Occupancy studies may be easier to implement than some abundance or density estimators (Noon et al., 2012; Sollmann et al., 2018).
Occupancy-abundance relationships appear to be robust to territoriality, group travelling behaviour and other biological traits (Steenweg et al., 2018).
Occupancy can be modelled as a function of site- and sampling-specific covariates to better understand which factors predict animal occurrence (Sollmann et al., 2018).
However, many researchers have cautioned against the use occupancy as an index. As with relative abundance (RA; see above), there is no consistent, long-term relationship between occupancy and abundance (Efford & Dawson, 2012). Occupancy can change with abundance, but also with survey duration, species home range size, animal movement, etc., muddling occupancy-abundance relationships and thus inferences about population size (Neilson et al., 2018; Steenweg et al., 2018). While occupancy is a powerful stand-alone metric, Sollmann (2018) says it should not be “misinterpreted” as an index of abundance.
Despite its widespread use, occupancy may be particularly problematic for camera trap studies due to the violation of the closure assumption. Burton et al. (2015) highlighted that many camera trap studies using occupancy do not explicitly define the “site,” although is often implicitly given as some larger area around a camera trap. Since camera trap studies typically target mammal species with relatively large home ranges, the site closure assumption is almost certainly violated in most cases. Many camera trappers therefore assume that “occupancy” is in fact “use” of a site (i.e., the site is not closed), and that detection probability also includes availability for detection. Mackenzie et al. (2017) suggested that estimates should be unbiased if movements in and out of a site are random, but this assumption is rarely tested. And where occupancy estimates have been tested using realistic mammal movements, they have generally performed poorly (Neilson et al., 2018; Stewart et al., 2018).
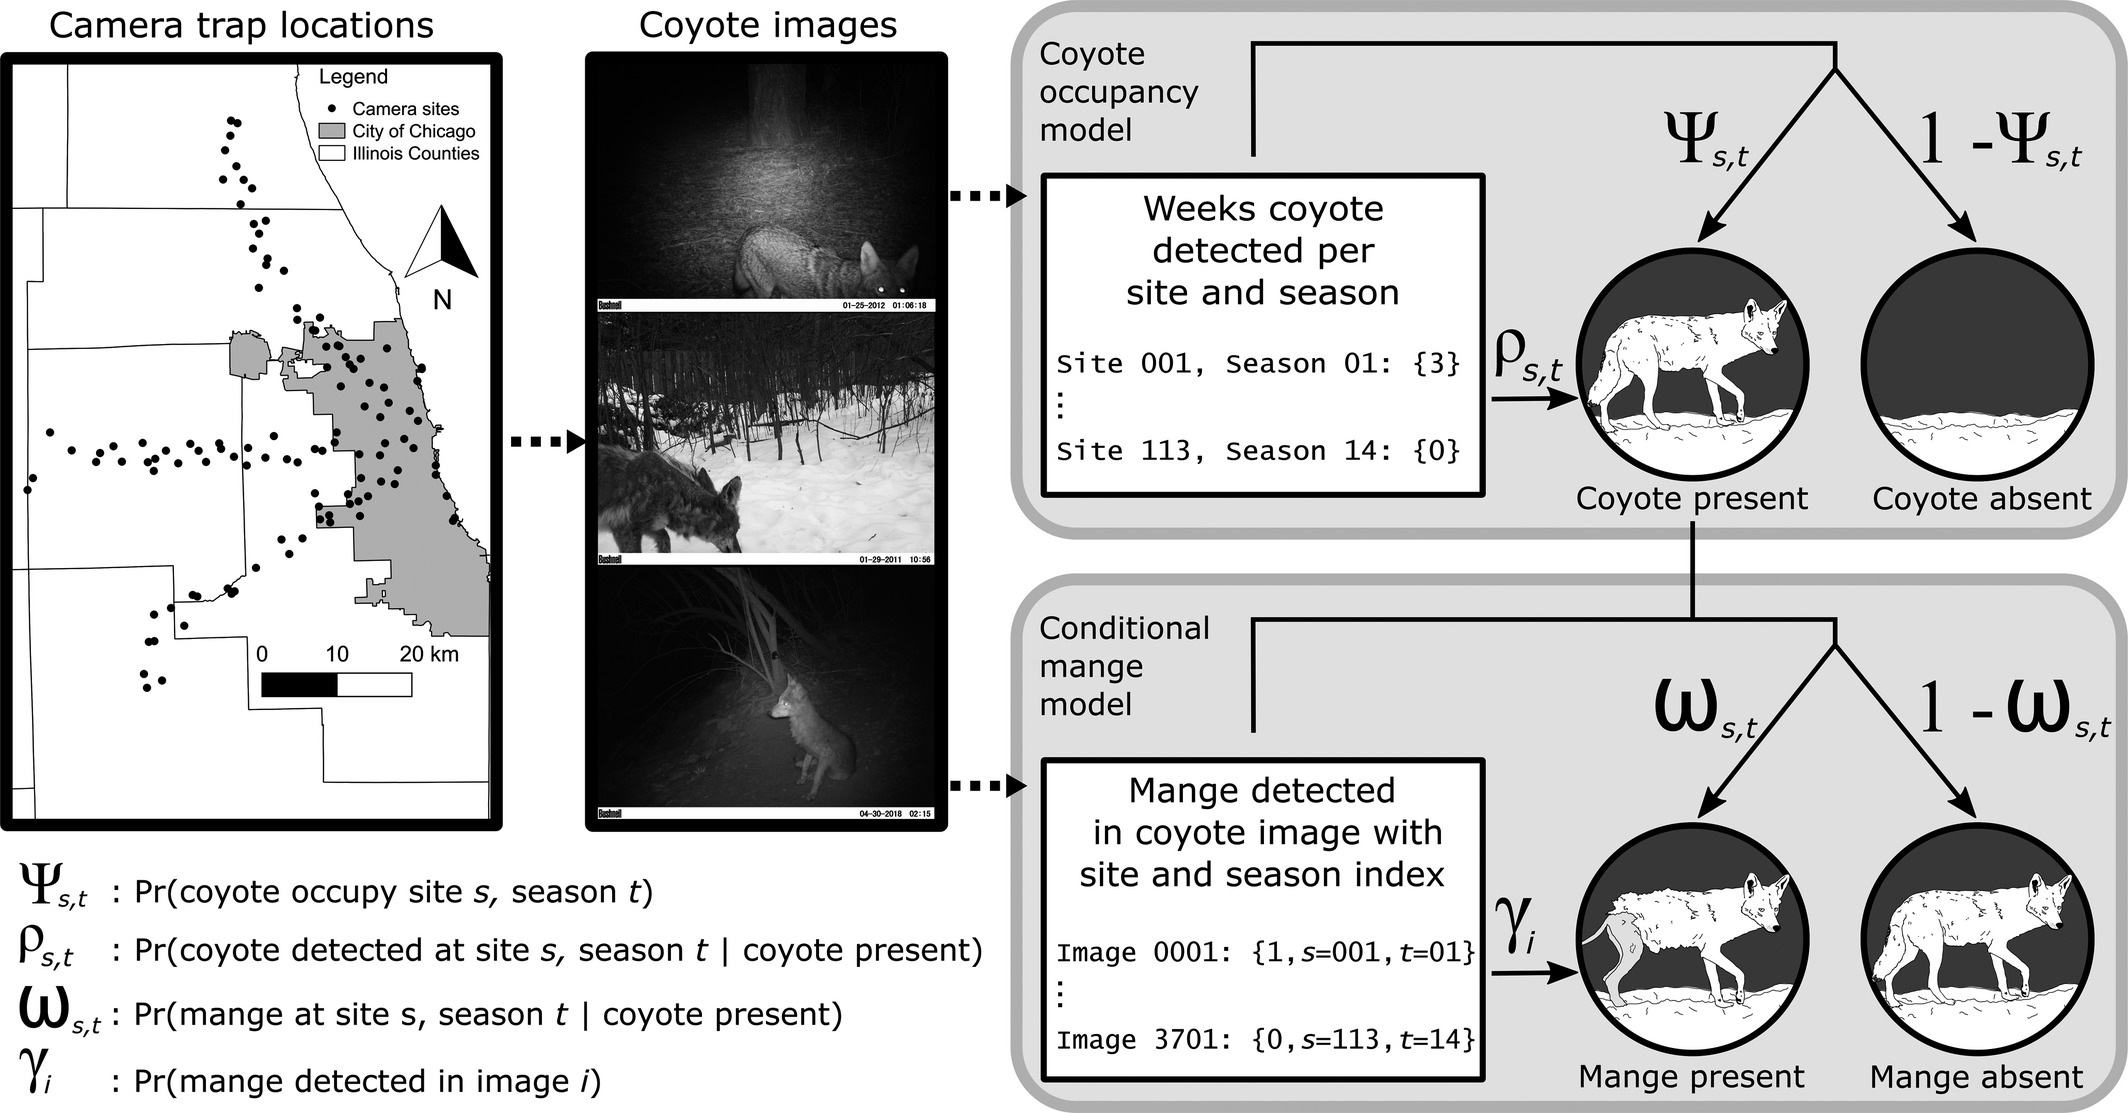
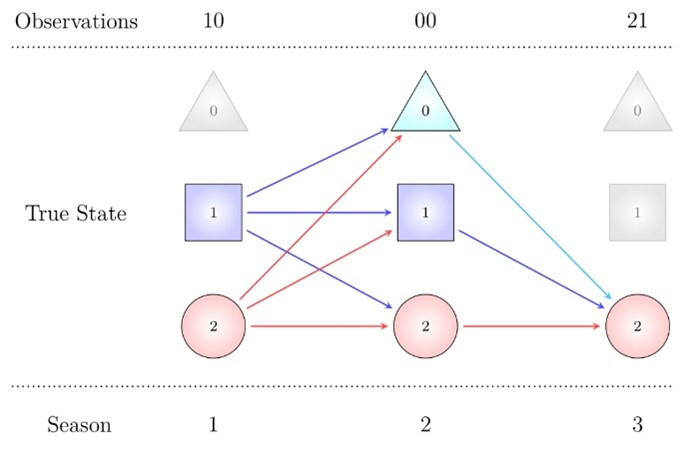
Murray et al. (2021) - Fig. 1 Schematic of our multi- state occupancy model to estimate the occurrence of coyotes and mange.
We used images of coyotes collected along transects following an urban gradient in the Chicago metro area in a standard single-species multi-season model with a stacked design. Following the coyote occupancy model, our mange model estimates the distribution of coyote with sarcoptic mange conditional on the distribution of coyote, mangy or otherwise, using by-image variation in the presence of mange signs and the quality of the image.
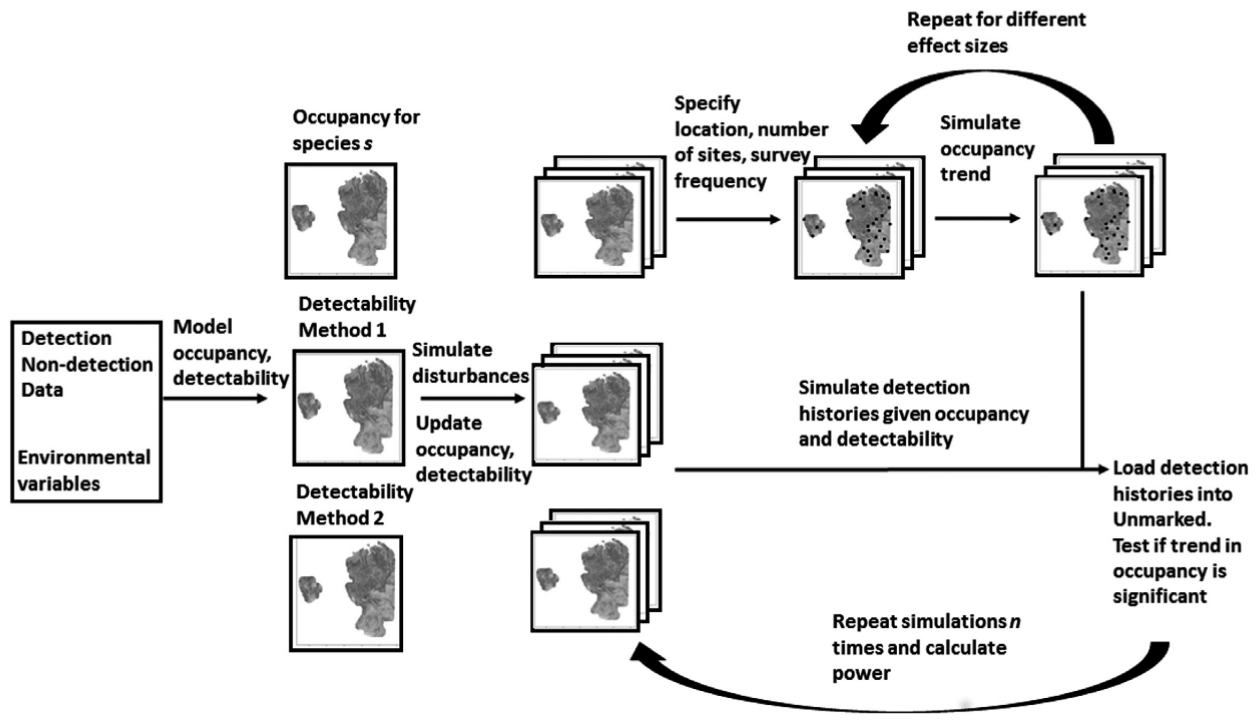
Southwell et al. (2019) - Fig. 1. Structure of the spatially explicit power analysis framework for multiple species in dynamic landscapes.
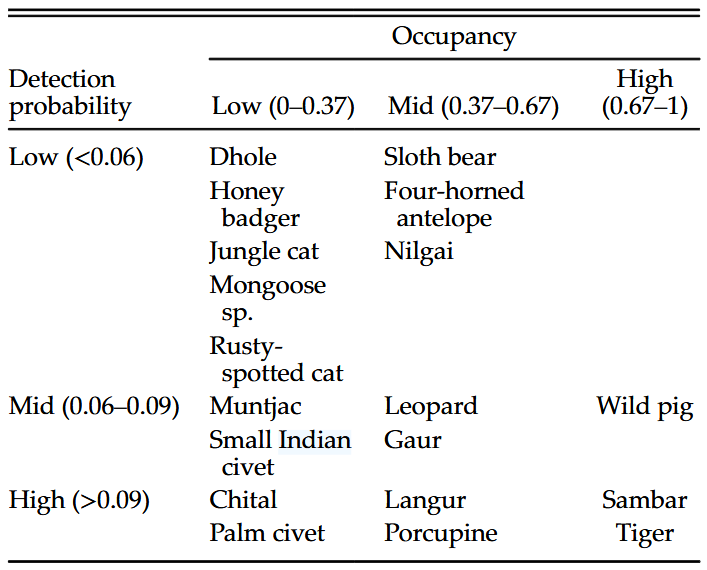
Chatterjee et al. (2021) - Table 2. Broad classifications of mammals based on occupancy and detection probabilities.
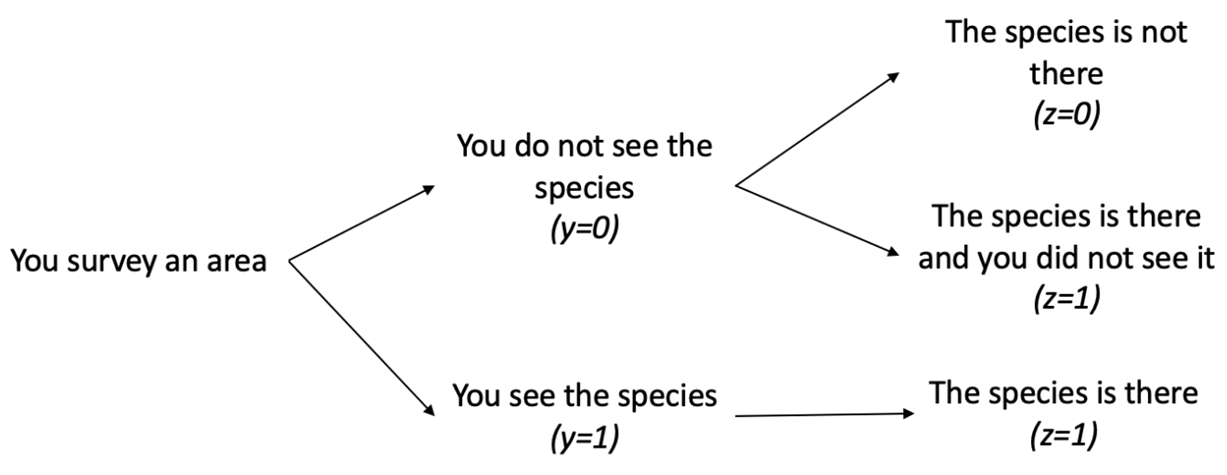
Byrne & Golden (2021) - The problem that occurs when we do not observe the species is that we do not know which of the two possible outcomes is true. If we did not see the species, we cannot know if it was truly there or truly not there because we did not observe it. This is where occupancy modeling can be helpful; we can use occupancy models to help us determine our detection probability and estimate our latent variable z, which is our true occupancy, and our occupancy probability ψψ. By using this approach, we can estimate the probability that the site is actually occupied given we do not observe the individual.
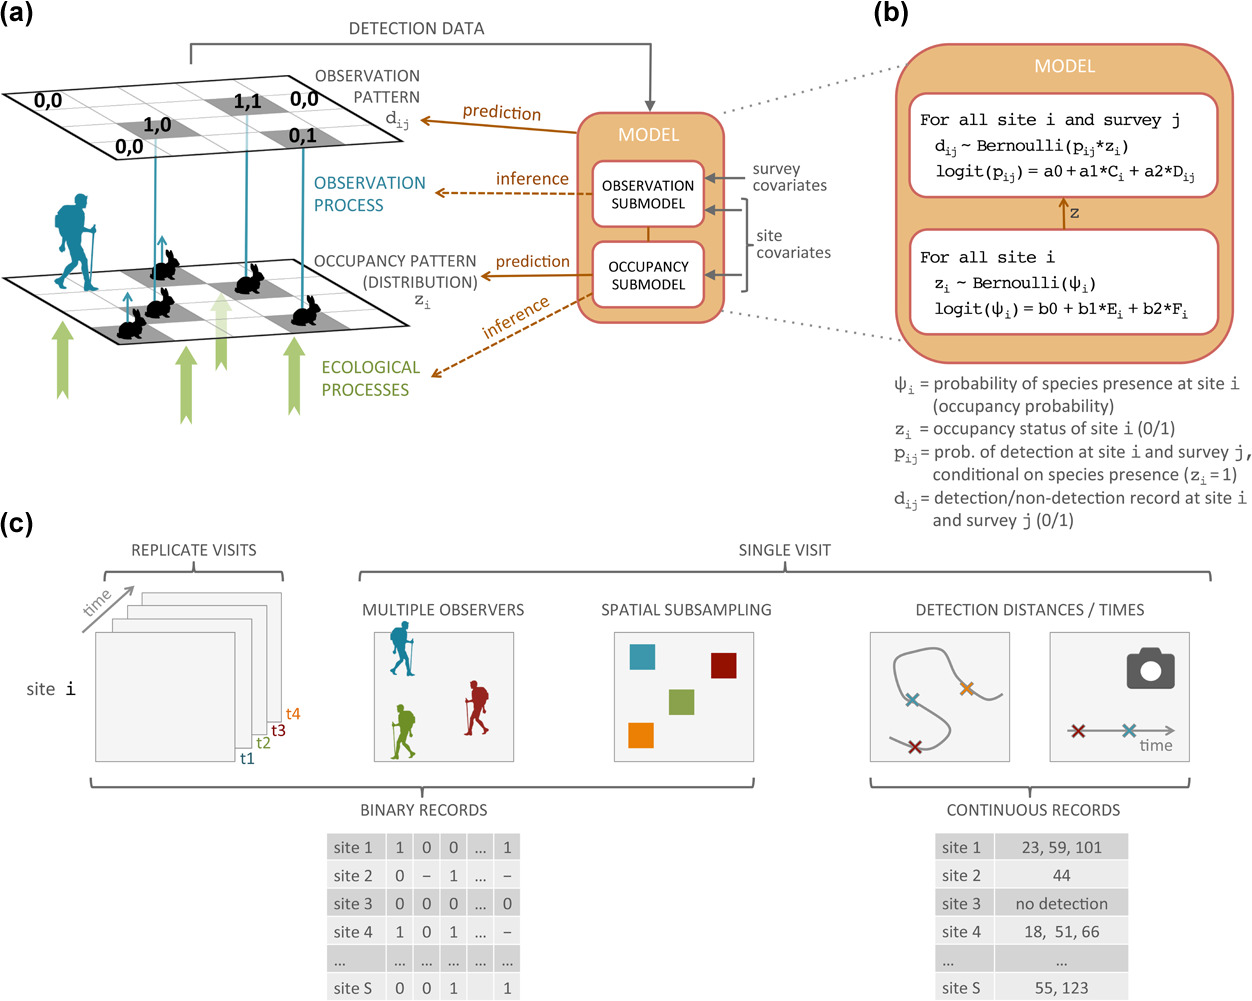
Guillera‐Arroita (2016) - Fig. 1 Species distribution modelling with imperfect detection: model structure and data needs.
(a) The model has two components: one that describes the distribution of the species as a function of environmental covariates; and one that describes how that distribution pattern is observed which can depend both on environmental covariates at the site level and on the characteristic of the specific survey visit. (b) Example of the statistical construction of one of these models. Here detection data comes in the form of binary records dij. Presenceabsence of the species at a site zi is modelled using a logistic regression, as a function of two site-level predictors: E and F. Detection probability pij at occupied sites is modelled through a second logistic regression as a function of two covariates: C, which is site specific, and D, which is survey specific. The model assumes that the occupancy status of the site (zi) does not change between survey occasions (closure assumption). This model assumes no false positives, i.e. all detections are 0 at sites where the species is not present (zi = 0). (c) Examples of data that provide information to account for false absences in species distribution models.


Occupancy Modeling Video 1 - Sampling Techniques for Mammals
Occupancy Modeling Video 2 -Introductory Statistical Review
Occupancy Modeling Video 3 - What are Occupancy Models and What are the Applications?
Occupancy Modeling Video 4 - How to Run and Interpret the Models in PRESENCE
Occupancy modelling - more than species presence/absence! (Darryl MacKenzie)
Occupancy modelling - the difference between probability and proportion of units occupied
Occupancy models - how many covariates can I include?
Introduction to Species Distribution Modeling Using R
shiny_name
shiny_caption
Bias in single-season occupancy models
Compute the relative bias (in %) in the maximum-likelihood estimator of the occupancy probability ψ in a single-season (aka static) occupancy model with constant parameters fitted with the package ‘unmarked’.
Type |
Name |
Note |
URL |
Reference |
|---|---|---|---|---|
rJAGS/R code |
mfidino/multi-state-occupancy-models |
Fidino, M. (2021a) multi-state-occupancy-models. https://github.com/mfidino/integrated-occupancy-model |
||
JAGS/R code |
A gentle introduction to an integrated occupancy model that combines presence-only and detection/non-detection data, and how to fit it in JAGS; |
https://masonfidino.com/bayesian_integrated_model/; |
Fidino, M. (2021b) A gentle introduction to an integrated occupancy model that combines presence-only and detection/non-detection data, and how to fit it in JAGS https://masonfidino.com/bayesian_integrated_model ; Fidino, M. (2021c) integrated-occupancy-models https://github.com/mfidino/integrated-occupancy-model |
|
JAGS code/Tutorial |
So, you don’t have enough data to fit a dynamic occupancy model? An introduction to auto-logistic occupancy models; |
|||
https://masonfidino.com/autologistic_occupancy_model/; |
Fidino, M. (2021d) So, you don’t have enough data to fit a dynamic occupancy model? An introduction to auto-logistic occupancy models. https://masonfidino.com/autologistic_occupancy_model ; Fidino, M. (2021e) auto-logistic-occupancy. https://github.com/mfidino/auto-logistic-occupancy |
|||
R package |
Package “autoOcc” |
An R package for fitting autologistic occupancy models |
Fidino, M. (2023) autoOcc: An R package for fitting autologistic occupancy models. R package version 0.1.1, https://github.com/mfidino/autoOcc |
|
R code |
mfidino/periodicity |
Using Fourier series to predict periodic patterns in dynamic occupancy models |
Fidino, M., & Magle, S. B. (2017). Using Fourier series to predict periodic patterns in dynamic occupancy models. Ecosphere,8(9) , e01944. https://doi.org/10.1002/ecs2.1944 |
|
Spreadsheet |
OccPower.xlsx |
Spreadsheet to compute power to detect difference in 2 independent occupancy estimates using asymptotic approximations described in Guillera-Arroita et. al. (2012). |
Guillera-Arroita, G., & Lahoz-Monfort, J. J. (2012). Designing studies to detect differences in species occupancy: Power analysis under imperfect detection. Methods in Ecology and Evolution, 3(5), 860-869. https://doi.org/10.1111/j.2041-210X.2012.00225.x |
|
R code/Tutorial |
“An Introduction to Camera Trap Data Management and Analysis in R > Chapter 11 Occupancy” |
https://bookdown.org/c_w_beirne/wildCo-Data-Analysis/occupancy.html |
WildCo Lab (2021c). Chapter 11 Occupancy. https://bookdown.org/c_w_beirne/wildCo-Data-Analysis/occupancy.html |
|
Program |
Program “PRESENCE” |
“Relatively simple, but comprehensive, software dedicated to occupancy estimation. Linux version available. Can also be used for occupancy-based species richness estimation.” (Wearn & Glover-Kapfer, 2017) |
Software: <www.mbr-pwrc.usgs.gov/software/presence.html>; |
Hines, J. E. (2006). PRESENCE - Software to estimate patch occupancy and related parameters. https://www.mbr-pwrc.usgs.gov/software/presence.html. |
R package |
Package “RPresence” |
“The R counterpart to Presence. Cross-platform (Windows, Mac and Linux).” (Wearn & Glover-Kapfer, 2017) |
Hines, J. E. (2006). PRESENCE - Software to estimate patch occupancy and related parameters. https://www.mbr-pwrc.usgs.gov/software/presence.html. |
|
R package |
R package “unmarked” |
“Implements a wide variety of occupancy and count-based abundance models (the latter are mostly not appropriate for camera-trapping). Actively being developed and supported by a community of users. Cross-platform (Windows, Mac and Linux).” (Wearn & Glover-Kapfer, 2017) |
https://cran.r-project.org/web/packages/unmarked/index.html; |
Fiske, I. & Chandler, R. (2011). unmarked: An R Package for Fitting Hierarchical Models of Wildlife Occurrence and Abundance. Journal of Statistical Software, 43(10), 1-23. https://www.jstatsoft.org/v43/i10 ; Kellner, K. F., Smith, A. D., Royle, J. A., Kery, M, Belant, J. L., & Chandler, R. B. (2023). The unmarked R package: Twelve years of advances in occurrence and abundance modelling in ecology. Methods in Ecology and Evolution, 14 (6), 1408-1415. https://www.jstatsoft.org/v43/i10/ |
R code/Tutorial |
Multi-season Occupancy Models |
McNeil, D. (n.d.). Multi-season Occupancy Models. https://darinjmcneil.weebly.com/multi-season-occupancy.html |
||
R package |
Package “detect” |
R package for analyzing wildlife data with detection error |
Solymos, P. (2023). Package ‘detect’: Analyzing Wildlife Data with Detection Error. R package version 0.4-6. https://cran.r-project.org/web/packages/detect/detect.pdf |
|
R code/Tutorial |
Occupancy Modeling |
Easy to follow explanation of occupancy models with accompanying tutorial and R code. |
||
Tutorial |
occupancyTuts: Occupancy modelling tutorials with RPresence |
Occupancy modelling tutorials with RPresence |
Donovan, T., Hines, J., & MacKenzie, D. (2024). OCCUPANCYTUTS: Occupancy modelling tutorials with RPRESENCE. Methods in Ecology and Evolution, 15(3), 477-483. https://doi.org/10.1111/2041-210X.14285 |
|
R code/Tutorial |
Implicit dynamics occupancy models in R |
Implicit dynamics occupancy models with the R package RPresence. These models estimate occupancy probability when it changes through time without estimating colonization and extinction parameters. |
https://jamesepaterson.github.io/jamespatersonblog/2024-06-02_implicitdynamicsoccupancy.html |
Paterson, J. (2024). Implicit dynamics occupancy models in R. https://jamesepaterson.github.io/jamespatersonblog/2024-06-02_implicitdynamicsoccupancy.html |
Tutorial |
Using the mgcvmgcv package to create a generalized additive occupancy model in R |
https://masonfidino.com/generalized_additive_occupancy_model |
Fidino, M. (2021F) Using the mgcvmgcv package to create a generalized additive occupancy model in R. https://masonfidino.com/generalized_additive_occupancy_model |
|
R Shiny app |
Bias in single-season occupancy models |
“Compute the relative bias (in %) in the maximum-likelihood estimator of the occupancy probability ψ in a single-season (aka static) occupancy model with constant parameters fitted with the package ‘unmarked’.” |
Repo: oliviergimenez/bias_occupancy_flexdashboard |
Gimenez, O. (2020a). Bias in single-season occupancy models. https://ecologicalstatistics.shinyapps.io/bias_occupancy; |
R code |
Bias in occupancy estimate for a static model |
“R code to calculate bias in occupancy estimate as a function of the detection probability given various levels of occupancy probability, various number of sites and surveys.” |
Gimenez, O. (2020b). Bias in occupancy estimate for a static model. https://github.com/oliviergimenez/bias_occupancy |
|
R code/ Presentation |
Species Distribution Modelling |
‘Vernon Visser provided a brief introduction to SDMs. Below you can replace the lecture slides and R script from this seminar. Provided in these materials is: |