Home range size#
Hint
Home range size: the size of the area within which an animal normally lives and finds what it needs to survive and reproduce.
Unsure about the of your Target Species? There may be information available in the “Species home range / body size lookup”; see the Shiny Apps/Widgets tab of the info-box below.
Note:
will not be exactly the same for every animal of a certain species; when thinking of home range size in the context of study design, we are really thinking about the average for individuals of that species for the duration of your study.
information should, ideally, be chosen to reflect the conditions of your study (as closely as possible). For example, data from a study that only reported for one season (e.g., summer ) might bias placement if your study aims to evaluate your variable of interest (e.g., ‘occupancy’) over multiple seasons, especially if the species’ movement highly differs between seasons (e.g., moves more in summer).
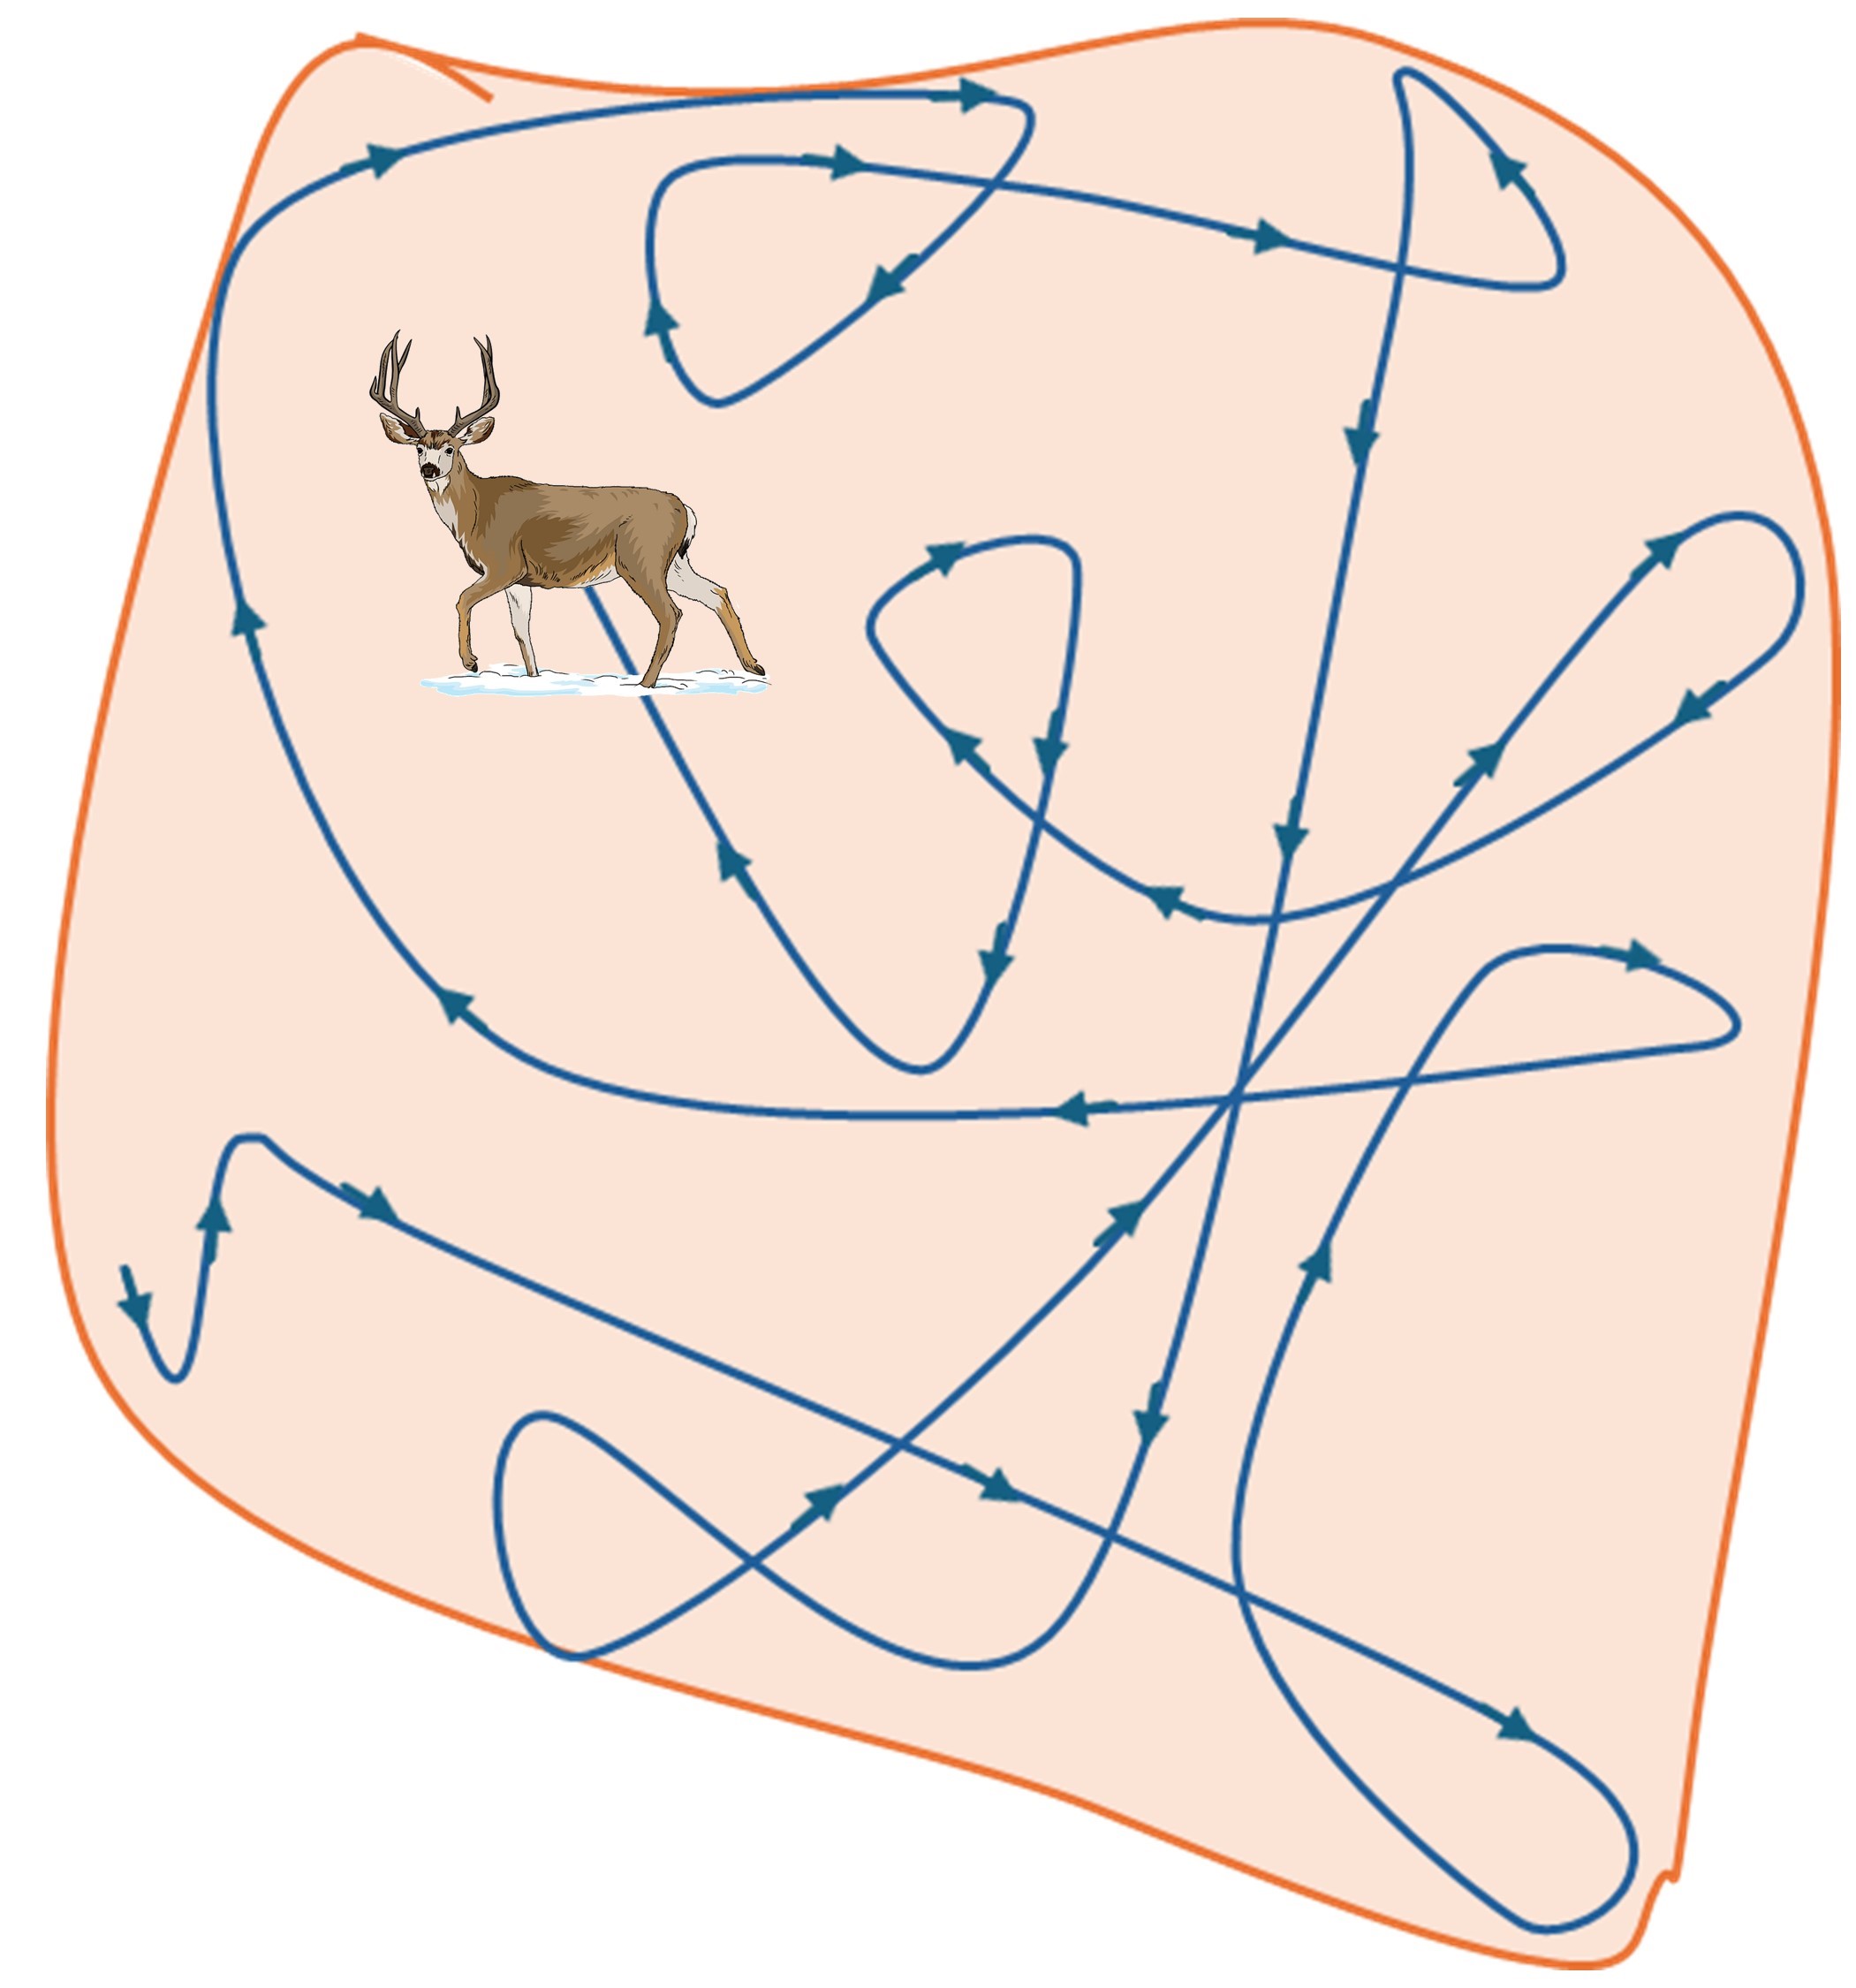
Home range size: the size of the area within which an animal normally lives and finds what it needs to survive and reproduce.
Note
will not be exactly the same for every animal of a certain species; when thinking of home range size in the context of study design, we are really thinking about the average for individuals of that species for the duration of your study.
information should, ideally, be chosen to reflect the conditions of your study (as closely as possible). For example, data from a study that only reported for one season (e.g., summer ) might bias placement if your study aims to evaluate your variable of interest (e.g., ‘occupancy’) over multiple seasons, especially if the species’ movement highly differs between seasons (e.g., moves more in summer).
How does this relate to study design?
information is used in this tool to determine ‘camera spacing’ and the ‘number of cameras’ required. This is because how far animals can move will ultimately affect whether the data collected from different locations (or observations of different individuals) are independent of one another.
This is one aspect of the “” (i.e., ) assumption of many modelling approaches (e.g., occupancy models [MacKenzie et al., 2004]).’Site independence’ is often used interchangeably with ‘site closure’, however, the concept of ‘site independence’ also considers spatial autocorrelation, or “The tendency for locations that are closer together to be more similar..” To meet these assumption, its often suggested to space cameras far enough apart that the same individuals or groups of animals are not influencing data from multiple sites (e.g., either by being detected or influencing detection at multiple sites, i.e., camera spacing is larger than the diameter of the species’ home range size). However, its not always ideal to space cameras far enough apart to ensure ‘site closure’ and ‘site independence’ assumptions are met. For some approaches, such as capture-recapture [CITE], the opposite is true; sites should be sufficiently close to one another such that individuals ARE picked up across more than one location (‘dependence’ is required). Meeting these assumptions (i.e., ‘site independence’ and/or ‘site dependence’ [approach-dependent]) is important to ensure that the model results are valid (avoid biased results and incorrect conclusions).
Refer to the “in-depth” tab for more information.
This section will be available soon! In the meantime, check out the information in the other tabs!
The must also be short enough that the probability of occupancy does not change (i.e., not confounded by other processes, e.g., by changes in the population) (O’Connell et al., 2011).
Species with higher dispersal ability (i.e., able to travel further distances) are more likely to be absent during the survey (Wearn & Glover-Kapfer, 2017).
For example, home range size “has implications for the interpretation of occupancy. If animals range over a much larger area than a single site, then a) they may conceivably be unavailable for capture during a sampling occasion, and b) the “occupancy” of a site is more related to the ranging patterns and habitat preferences of an individual, rather than the coarse-scale distribution of a species” (Wearn & Glover-Kapfer, 2017).
For some approaches, violation of this assumption can result in an underestimate of detection probabilities and, in turn, over-estimate density (e.g., with spatial recapture models) or result in simply averaging detections over the sampling period (e.g., REM [Rowcliffe et al., 2008; Rowcliffe et al., 2013], REST [Nakashima et al., 2017] models).
Home range: the area within which an animal normally lives and finds what it needs to survive and reproduce.


A R Shiny app created for the RC Decision Support Tool to allows users lookup information on species home range size / body size; information pulled directly from the following sources:
Burton et al. (2015) supplementary material “S2. Average body mass and home range size for a sample of species and studies among the reviewed set of camera trap publications”
PanTHERIA database (Jones et al., 2009) “a species-level database of life history, ecology, and geography of extant and recently extinct mammals
HomeRange: A global database of mammalian home ranges (Broekman et al., 2022)
Note
Home range size information should, ideally, be chosen to reflect the conditions of your study (as closely as possible). For example, data from a study that only reported home range size for one season (e.g., summer home range size) might bias placement, if your study aims to evaluate occupancy over multiple seasons, especially if the species’ movement highly differs between seasons (e.g., moves more in summer).
Type |
Name |
Note |
URL |
Reference |
|---|---|---|---|---|
Data/Database |
HomeRange: A global database of mammalian home range |
HomeRange, a global database with 75,611 home- range values across 960 different species of mammals, including terrestrial, aquatic and aerial species |
Article:https://onlinelibrary.wiley.com/doi/epdf/10.1111/geb.13625; |
Broekman, M. J. E., Hoeks, S., Freriks, R., Langendoen, M. M., Runge, K. M., Savenco, E., Ter Harmsel, R., Huijbregts, M. A. J., & Tucker, M. A. (2023). HomeRange: A global database of mammalian home ranges. Global Ecology and Biogeography, 32(2), 198-205. https://doi.org/10.1111/geb.13625 |
Data/Database |
Supplementary material; PanTHERIA |
PanTHERIA: a species-level database of life history, ecology,and geography of extant and recently extinct mammals |
Jones, K. E., Bielby, J., Cardillo, M., Fritz, S. A., O’Dell, J., Orme, C. D. L., Safi, K., Sechrest, W., Boakes, E. H., Carbone, C., Connolly, C., Cutts, M. J., Foster, J. K., Grenyer, R., Habib, M., Plaster, C. A., Price, S. A., Rigby, E. A., Rist, J., … Purvis, A. (2009). PanTHERIA: a species-level database of life history, ecology, and geography of extant and recently extinct mammals. Ecology, 90(9), 2648-2648. https://doi.org/10.1890/08-1494.1 |
|
Data/Database |
Supplementary material; Wildlife camera trapping: a review and recommendations for linking surveys to ecological processes |
Burton et al. (2015) |
Article: https://besjournals.onlinelibrary.wiley.com/doi/full/10.1111/1365-2664.12432; |
Burton, A. C., Neilson, E., Moreira, D., Ladle, A., Steenweg, R., Fisher, J. T., Bayne, E., Boutin, S., & Stephens, P. (2015). Camera trap Trapping: A Review and Recommendations for Linking Surveys to Ecological Processes. Journal of Applied Ecology, 52(3), 675-685. https://doi.org/10.1111/1365-2664.12432 |
R package |
Package ‘HomeRange’ |
HomeRange data: the R package can be used to download and import the HomeRange data |
Hoeks, S., Tucker, M., & Broekman, M. (2024). HomeRange SHoeks/HomeRange |
Broekman, M. J. E., Hoeks, S., Freriks, R., Langendoen, M. M., Runge, K. M., Savenco, E., Ter Harmsel, R., Huijbregts, M. A. J., & Tucker, M. A. (2023). HomeRange: A global database of mammalian home ranges. Global Ecology and Biogeography, 32(2), 198-205. https://doi.org/10.1111/geb.13625
Burton, A. C., Neilson, E., Moreira, D., Ladle, A., Steenweg, R., Fisher, J. T., Bayne, E., Boutin, S., & Stephens, P. (2015). Camera trap Trapping: A Review and Recommendations for Linking Surveys to Ecological Processes. Journal of Applied Ecology, 52(3), 675-685. https://doi.org/10.1111/1365-2664.12432
Hoeks, S., Tucker, M., & Broekman, M. (2024). HomeRange SHoeks/HomeRange
Jones, K. E., Bielby, J., Cardillo, M., Fritz, S. A., O’Dell, J., Orme, C. D. L., Safi, K., Sechrest, W., Boakes, E. H., Carbone, C., Connolly, C., Cutts, M. J., Foster, J. K., Grenyer, R., Habib, M., Plaster, C. A., Price, S. A., Rigby, E. A., Rist, J., … Purvis, A. (2009). PanTHERIA: a species-level database of life history, ecology, and geography of extant and recently extinct mammals. Ecology, 90(9), 2648-2648. https://doi.org/10.1890/08-1494.1
MacKenzie, D. I., Bailey, L. L., & Nichols, J. D. (2004). Investigating Species Co-Occurrence Patterns When Species Are Detected Imperfectly. Journal of Animal Ecology, 73(3), 546-555. https://doi.org/10.1111/j.0021-8790.2004.00828.x
Nakashima, Y., Fukasawa, & K., Samejima, H. (2017). Estimating Animal Density Without Individual Recognition Using Information Derivable Exclusively from Camera Traps. Journal of Applied Ecology, 55(2), 735-744. https://doi.org/10.1111/1365-2664.13059
O’Connell, A. F., Talancy, N. W., Bailey, L. L., Sauer, J. R., Cook, R., & Gilbert, A. T. (2006). Estimating Site Occupancy and Detection Probability Parameters for Meso- And Large Mammals in a Coastal Ecosystem. Journal of Wildlife Management, 70(6), 1625-1633. https://doi.org/10.2193/0022-541X(2006)70[1625:ESOADP]2.0.CO;2
Rowcliffe, J. M., Field, J., Turvey, S. T., & Carbone, C. (2008). Estimating animal Density using camera traps without the need for individual recognition. Journal of Applied Ecology, 45(4), 1228-1236. https://doi.org/10.1111/j.1365-2664.2008.01473.x
Rowcliffe, J. M., Kays, R., Carbone, C., & Jansen, P. A. (2013). Clarifying assumptions behind the estimation of animal Density from camera trap rates. The Journal of Wildlife Management, 77(5), 876-876. https://doi.org/10.1002/jwmg.533