Body size#
Hint
Here are a few examples of comparable species for each body size options:
: Rodents and similarly sized species in the “Mustelidae” family [i.e., weasels, badgers, otters, martens, wolverine, etc.])
: Small and mid-sized species, ~< 33 lbs (or 15 kilograms), such as meso-carnivores (i.e., Red, fox, Coyote) (Roemer et al., 2009)
: Bears or ungulates (i.e., large mammals with hooves, such as White-tailed deer, Elk, Moose, etc)
:
Unsure about the size of your Target Species? There may be information available in the “Species home range / body size lookup”; see theShiny Apps/Widgets tab below.
Here are a few examples of comparable species for each body size options:
: Rodents and similarly sized species in the “Mustelidae” family [i.e., weasels, badgers, otters, martens, wolverine, etc.])
: Small and mid-sized species, ~< 33 lbs (or 15 kilograms), such as meso-carnivores (i.e., Red, fox, Coyote) (Roemer et al., 2009)
: Bears or ungulates (i.e., large mammals with hooves, such as White-tailed deer, Elk, Moose, etc)
:
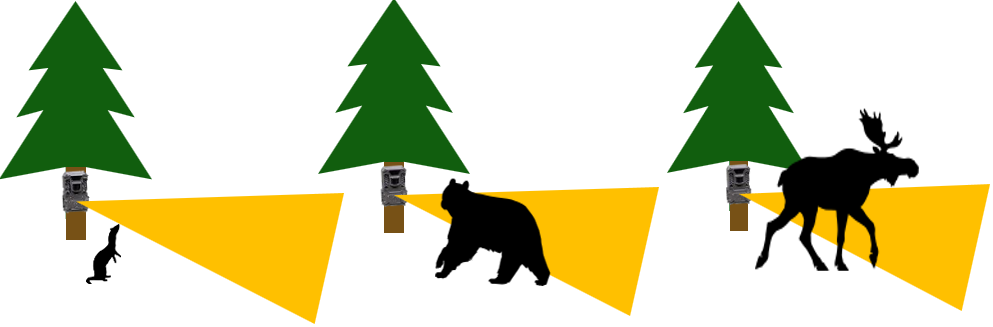
Kemp et al. (2022) - Pg 15 Fig 1 The graphic above shows how the height of the camera should reflect the size of the target animal to increase the chance of detection. In this case, the yellow area shows the field of view.
How does this relate to study design?
Body size affects the detection process (O’Brien et al., 2011). Species with a larger body size are more likely to be detected; and therefore may require lower sampling effort than smaller species (Chatterjee et al., 2021). Larger species moving through the camera’s detection zone are more likely to trigger the camera (Chatterjee et al., 2021; Rowcliffe et al., 2011; Hofmeester et al., 2017); they can also be detected farther away or occur at wider angles (Rowcliffe et al., 2011; ). Whereas, small mammals are often undetected due to their small size (O’Brien et al., 2011; Anile & Devillard, 2016) and because “small species which routinely move at fast speeds, such as stoats and weasels, are likely to have especially small detection zones” (Glen et al., 2013).
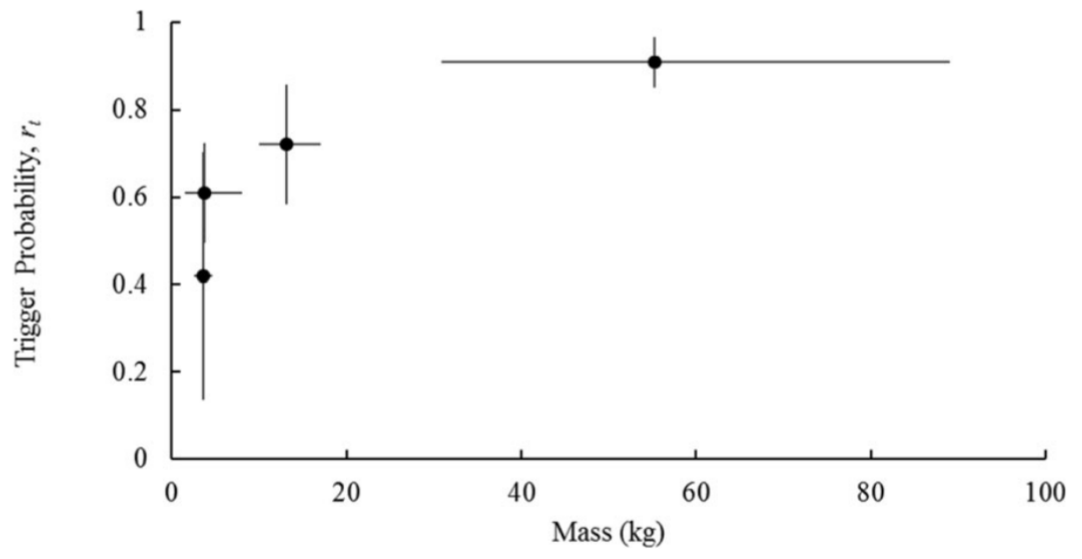
Kays et al. (2021) - Fig. 6: Relationship between trigger probability and body mass for four focal species (ascending order by weight: gray fox, raccoon, coyote, white-tailed deer). Error bars show standard deviation. Body mass values come from North Carolina animals in the mammal collections of the NC Museum of Natural Sciences.
When thinking beyond the camera’s FOV, larger species generally also have larger home ranges (Garland, 1983) and daily movement distances, making them more likely to be detected at multiple cameras (Chatterjee et al., 2021), therefore there are also implications for which models may be appropriate (due to assumptions of “site closure” / “independent locations”).
Note
This is an especially important consideration when targetting multiple species of varying sizes.
This section will be available soon! In the meantime, check out the information in the other tabs!
Kays et al. (2021) - Fig. 6 Relationship between trigger probability and body mass for four focal species (ascending order by weight: gray fox, raccoon, coyote, white-tailed deer). Error bars show standard deviation. Body mass values come from North Carolina animals in the mammal collections of the NC Museum of Natural Sciences
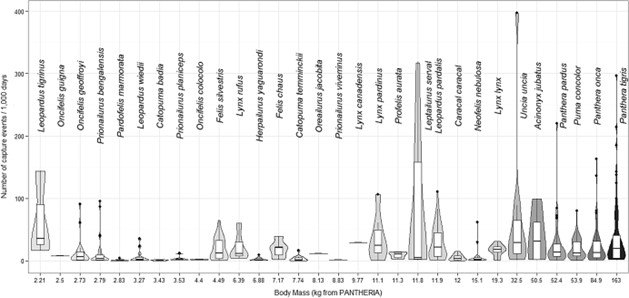
Anile & Devillard (2028) - Fig. 2 Violin plot of the trap rate, expressed as the number of capture events per 1000 days of camera trapping per species (n = 30) ordered by body mass (n = 513 records).
Some records appeared as ‘outliers’ in this figure, that is, particularly high numbers of capture events/1000 trapping hours for large felids (Uncia uncia, Panthera tigris). These data were not included in the reduced dataset used in modelling as some data were lacking (either inter-trap distance, type and number of camera used as well as if they were used in pair). Consequently, these particular records were not responsible of the observed positive relationship between RAI and body mass.
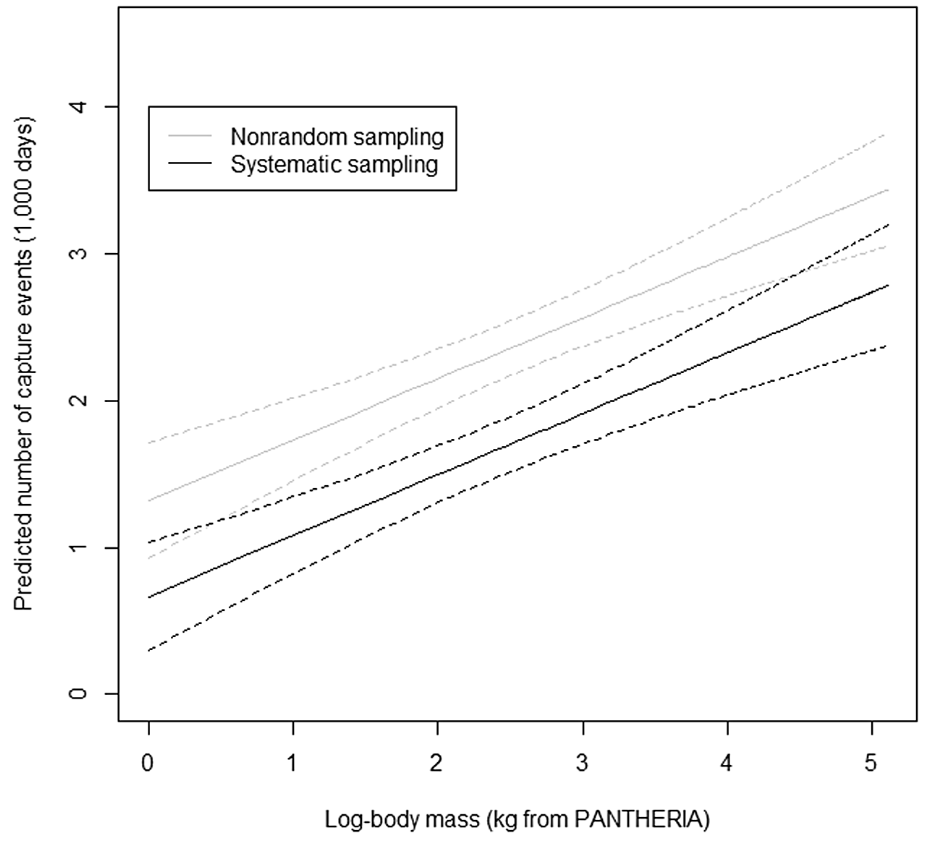
Anile & Devillard (2028) - Fig. 3 Predicted number of trapped individuals as a function of the log-transformed body mass and the type of study design (multispecies vs. single species).
Fitted values are predicted for fixed effects only from the averaged model. The number of trap hours th was fixed at = 1000 days, whereas the number of camera stations ncamstat, and the inter-trap distance intdist were fixed to their median values (ncamstat = 26, intdist = 1760 m, respectively), and, the type of camera used, the use of cameras in pairs, the use of bait or lures and whether the authors took into account the nonindependence of capture events were set to camtyp = A, campair = Y, baitlure = N, and ind.ce = N, that is, the most frequent design type used, to estimate fitted values.

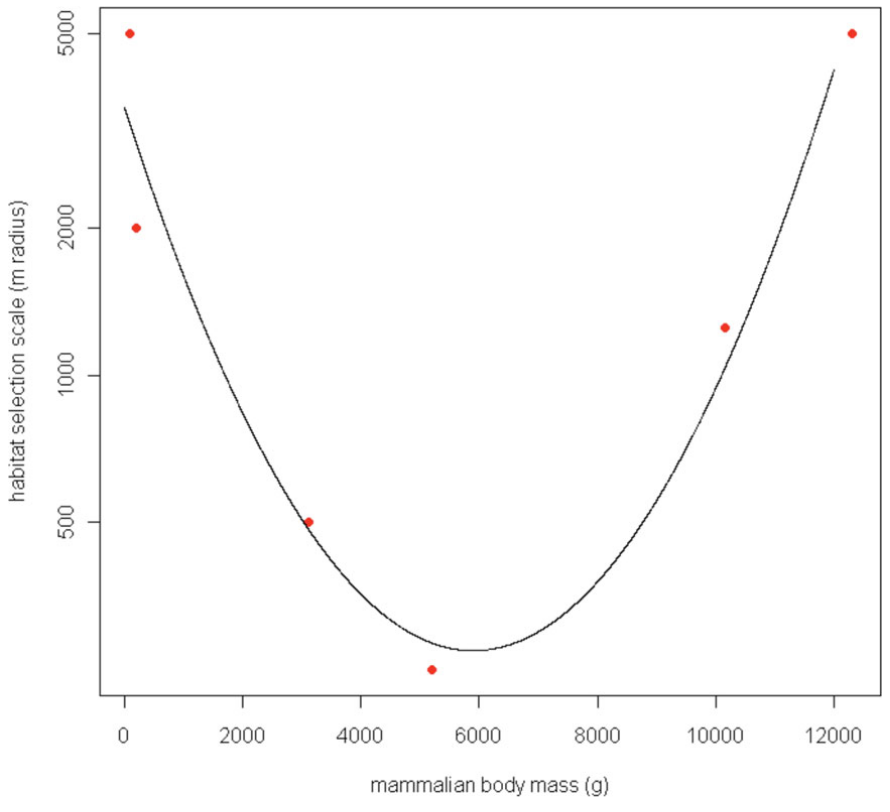
** Fisher et al. (2011) - Fig. 6** Characteristic scale of habitat selection (determined by AIC weight, see Figs. 1 and 2), log-transformed and modeled against body mass of six mammal species for which a characteristic scale was detectable. Habitat quantified at large scales best predicts both small and large mammal occurrence, whereas habitat quantified at small scales best predicts occurrence of intermediate-sized mammals.
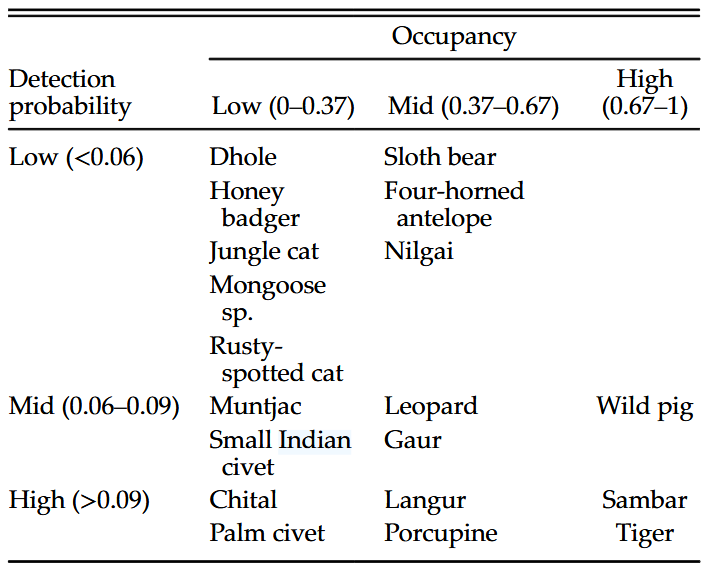
Chatterjee et al. (2021) - Table 2. Broad classifications of mammals based on occupancy and detection probabilities.
Kemp et al. (2022) - Pg 15 Fig 1 The graphic above shows how the height of the camera should reflect the size of the target animal to increase the chance of detection. In this case, the yellow area shows the field of view.

A R Shiny app created for the RC Decision Support Tool to lookup information on species home range size / body size; information pulled directly from the following sources:
Burton et al. (2015) supplementary material “S2. Average body mass and home range size for a sample of species and studies among the reviewed set of camera trap publications”
PanTHERIA database (Jones et al., 2009) “a species-level database of life history, ecology,and geography of extant and recently extinct mammals
HomeRange: A global database of mammalian home ranges (Broekman et al., 2022)
Type |
Name |
Note |
URL |
Reference |
|---|
Anile, S., & Devillard, S. (2016). Study Design and Body Mass Influence RAIs from Camera Trap Studies: Evidence from the Felidae. Animal Conservation, 19(1), 35-45. https://doi.org/10.1111/acv.12214
Blackburn, T., & Gaston, K. (1999). The relationship between animal abundance and body size: A review of the mechanisms. In A. Fitter & D. Raffaelli (Eds.), Advances In Ecological Research, Vol 28, 181-210. https://doi.org/10.1016/S0065-2504(08)60033-1
Broekman, M. J. E., Hoeks, S., Freriks, R., Langendoen, M. M., Runge, K. M., Savenco, E., Ter Harmsel, R., Huijbregts, M. A. J., & Tucker, M. A. (2023). HomeRange: A global database of mammalian home ranges. Global Ecology and Biogeography, 32(2), 198-205. https://doi.org/10.1111/geb.13625
Burton, A. C., Neilson, E., Moreira, D., Ladle, A., Steenweg, R., Fisher, J. T., Bayne, E., Boutin, S., & Stephens, P. (2015). Camera trap Trapping: A Review and Recommendations for Linking Surveys to Ecological Processes. Journal of Applied Ecology, 52(3), 675-685. https://doi.org/10.1111/1365-2664.12432
Chatterjee, N., Schuttler, T. G., Nigam, P., & Habib, B. (2021). Deciphering the rarity-detectability continuum: optimizing Survey design for terrestrial mammalian community. Ecosphere 12(9), e03748. https://doi.org/10.1002/ecs2.3748
Fisher, J. T., Anholt, B., & Volpe, J. P. (2011). Body Mass Explains Characteristic Scales of Habitat Selection in Terrestrial Mammals. Ecology and Evolution, 1(4), 517-528. https://doi.org/10.1002/ece3.45
Garland, T. (1983). The relation between maximal running speed and body mass in terrestrial mammals. Journal of Zoology, 199(2), 157-170. https://doi.org/10.1111/j.1469-7998.1983.tb02087.x
Glen, A. S., Cockburn, S., Nichols, M., Ekanayake, J., & Warburton, B. (2013) Optimising Camera Traps for Monitoring Small Mammals. PloS one, 8(6), Article e67940. https://doi.org/10.1371/journal.pone.0067940
Hofmeester, T. R., Rowcliffe, J. M., Jansen, P. A., Williams, R., & Kelly, N. (2017). A simple method for estimating the effective detection distance of camera traps. Remote Sensing in Ecology and Conservation, 3(2), 81-89. https://doi.org/10.1002/rse2.25
Jones, K. E., Bielby, J., Cardillo, M., Fritz, S. A., O’Dell, J., Orme, C. D. L., Safi, K., Sechrest, W., Boakes, E. H., Carbone, C., Connolly, C., Cutts, M. J., Foster, J. K., Grenyer, R., Habib, M., Plaster, C. A., Price, S. A., Rigby, E. A., Rist, J., … Purvis, A. (2009). PanTHERIA: a species-level database of life history, ecology, and geography of extant and recently extinct mammals. Ecology, 90(9), 2648-2648. https://doi.org/10.1890/08-1494.1
Kays, R., Hody, A., Jachowski, D. S., & Parsons, A. W. (2021). Empirical Evaluation of the Spatial Scale and Detection Process of Camera Trap Surveys. Movement Ecology, 9, 41. https://doi.org/10.1186/s40462-021-00277-3.
Kemp, C., Yarchuk, K., Menzies, A., & Popp, J. (2022). A Guide to Using Wildlife Cameras for Ecological Monitoring in a Community-based Context. WISE Lab. https://wildcams.ca/site/assets/files/1386/cbm_wildlife_camera_guide-_aug2022.pdf
LaBarbera, M. (2003). Analyzing Body Size as a Factor in Ecology and Evolution. Annual Review of Ecology and Systematics, 20(1), 97-117. https://doi.org/10.1146/annurev.es.20.110189.000525
O’Brien, T. G., & Kinnaird, M. F. (2011). Density estimation of sympatric carnivores using spatially explicit capture-recapture methods and standard trapping grid. Ecological Applications, 21(8), 2908-2916. https://www.jstor.org/stable/41417102
Roemer, G. W., Gompper, M. E., & Van Valkenburgh, B. (2009). The Ecological Role of the Mammalian Mesocarnivore. BioScience, 59(2), 165-173. https://doi.org/10.1525/bio.2009.59.2.9
Rowcliffe, M. J., Carbone, C., Jansen, P. A., Kays, R., & Kranstauber, B. (2011). Quantifying the sensitivity of camera traps: an adapted distance sampling approach. Methods in Ecology and Evolution, 2(5), 464-476. https://doi.org/10.1111/j.2041-210X.2011.00094.x