#
Overview
Remote camera locations (or sample stations) and their spatial arrangement are integral components of any study design; these choices will affect the user’s ability to draw inference(s) about the species or question of interest. There are many species-specific characteristics (e.g., body size, behaviour, rarity, etc.) and environmental factors (e.g., vegetation cover, snow depth) that influence the detection probability and probability of occurrence of a species, as well as the size of the area that should be surveyed (e.g., Becker et al., 2022; Hofmeester et al., 2019; Iknayan et al., 2014; Steenweg et al., 2019). When there are multiple Target Species, a mix of study designs may be valuable (Iannarilli et al., 2021; Van Wilgenburg et al., 2020).
The of the survey will determine the most appropriate study design (Appendix A - Table A2). There are five commonly used study designs in camera studies: , (grid), , (including ) and (or opportunistic) (Wearn & Glover-Kapfer 2017). A ) is also used when it is impractical to use another design. Sampling design can occur hierarchically, where one approach is used at a larger scale (i.e., to select grids to place cameras within), and another approach is used at a smaller scale (i.e., to select the location within each grid to place the camera). Refer to the following literature for additional recommendations on study design: Burton et al., 2015; Cusack et al., 2015; Fisher & Burton, 2012; ; O’Connell et al., 2011; Rovero et al., 2013; Steenweg et al., 2015; Wearn & Glover-Kapfer, 2017 and WildCAM’s “sampling design & effort section section” of their resource library (https://wildcams.ca/library/camera-trapping-papers-directory/).
Note that we refer to different configurations of cameras more generally as study design and sampling design; however, the term “Survey Design” is how the study design is referred to when it applies to an individual survey. There may be multiple for surveys within a project; the should be reported separately for each survey within a project. When the is hierarchical, “Hierarchical (multiple)*” should be reported and additional details should be included in the . Refer to the for more information.
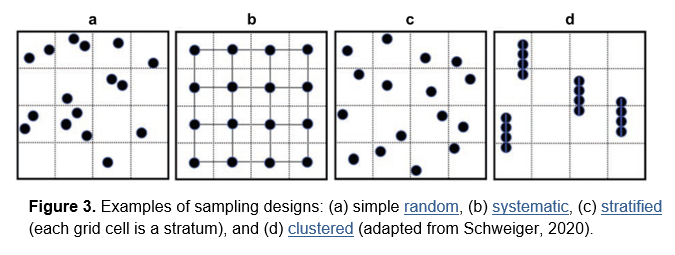
Figure 3. Examples of sampling designs: (a) simple , (b) systematic, (c) stratified (each grid cell is a ), and (d) (adapted from Schweiger, 2020).
Random (or “simple random”)
Random (or “simple random”) design (Figure 3a) – cameras occur at randomized locations (or sample stations) across the study area, sometimes with a predetermined minimum distance between camera locations (or sample stations). A may help reduce biases that arise from selecting camera locations deliberately. It may also allow the user to make inferences about areas that were not surveyed when employing use-based approaches (e.g. occupancy models [MacKenzie et al., 2002]; intensity of use methods [Keim et al., 2019]). Some modelling approaches(e.g., random encounter and staying time [REST]; Nakashima et al., 2017) and [random encounter models REM; Rowcliffe et al., 2008, 2013]) require a simple (Appendix A - Table A2).
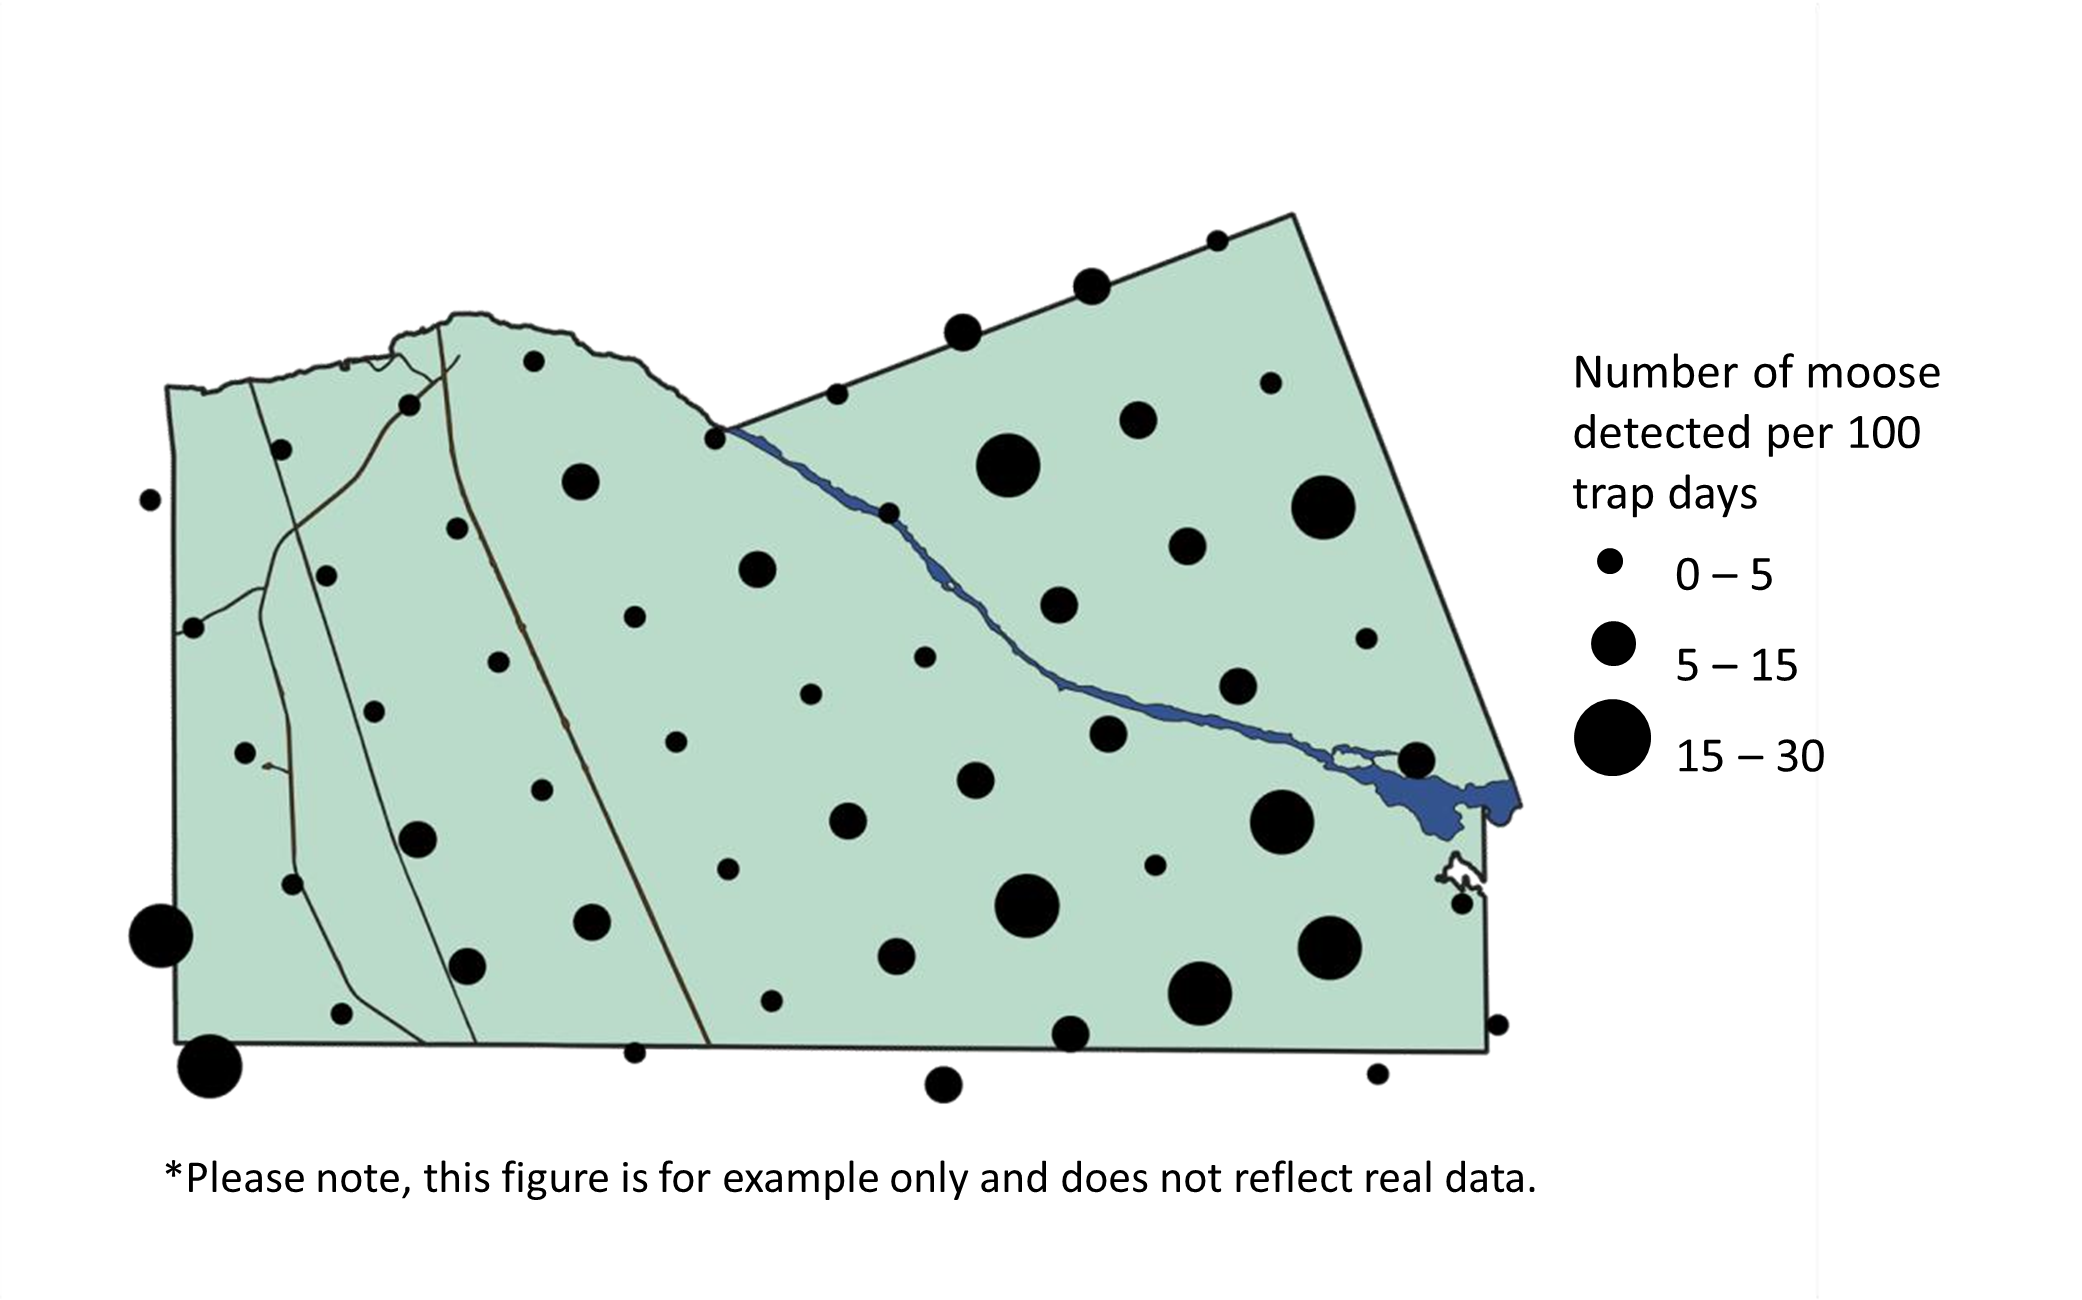
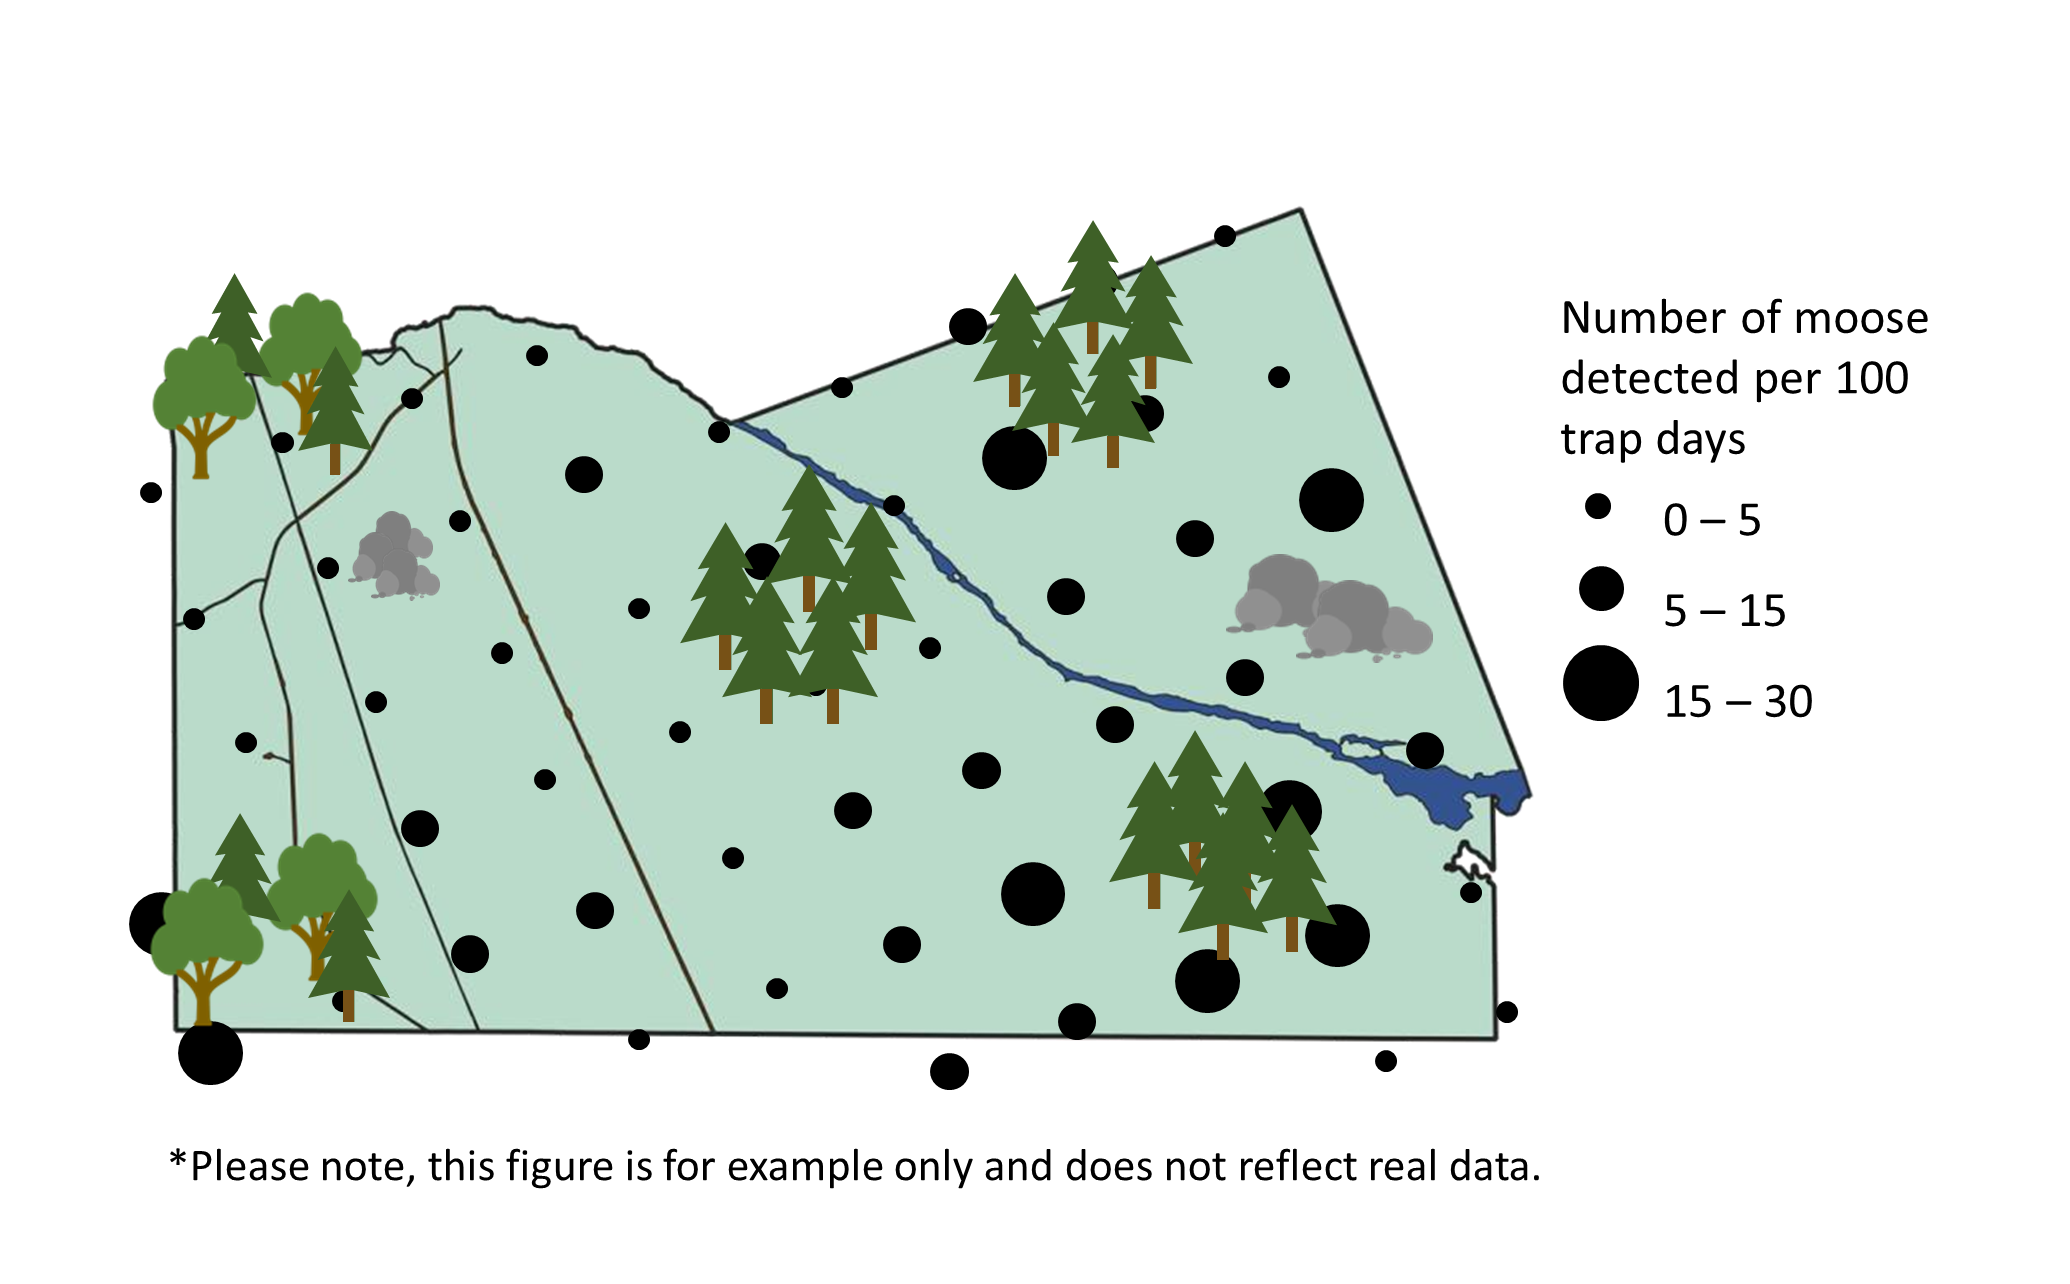
A disadvantage of using a simple random design is the tendency to see fewer animals (i.e., is less efficient) when animals are or exhibit habitat preferences, and the possibility of missing rare habitat types. The proportion of different strata (e.g., habitat types) sampled should be the same as (or close to) the true proportion in the study area. For example, if the study area consists of 25% young deciduous forest, then 25% of randomly selected sites should be within young deciduous forest, on average.
Systematic
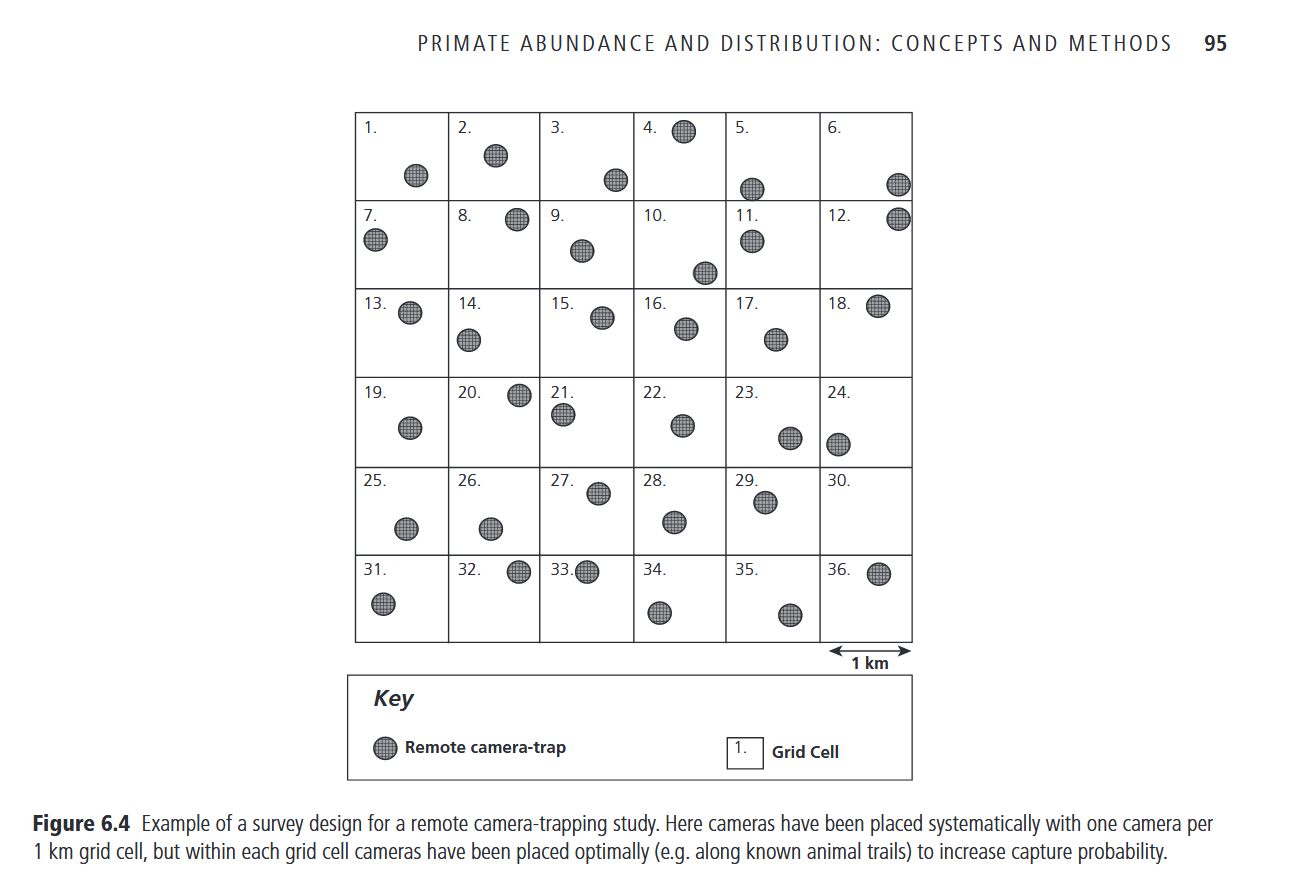
Systematic design (Figure 3b) – camera locations occur within a regular pattern (e.g., a grid pattern) across the study area.
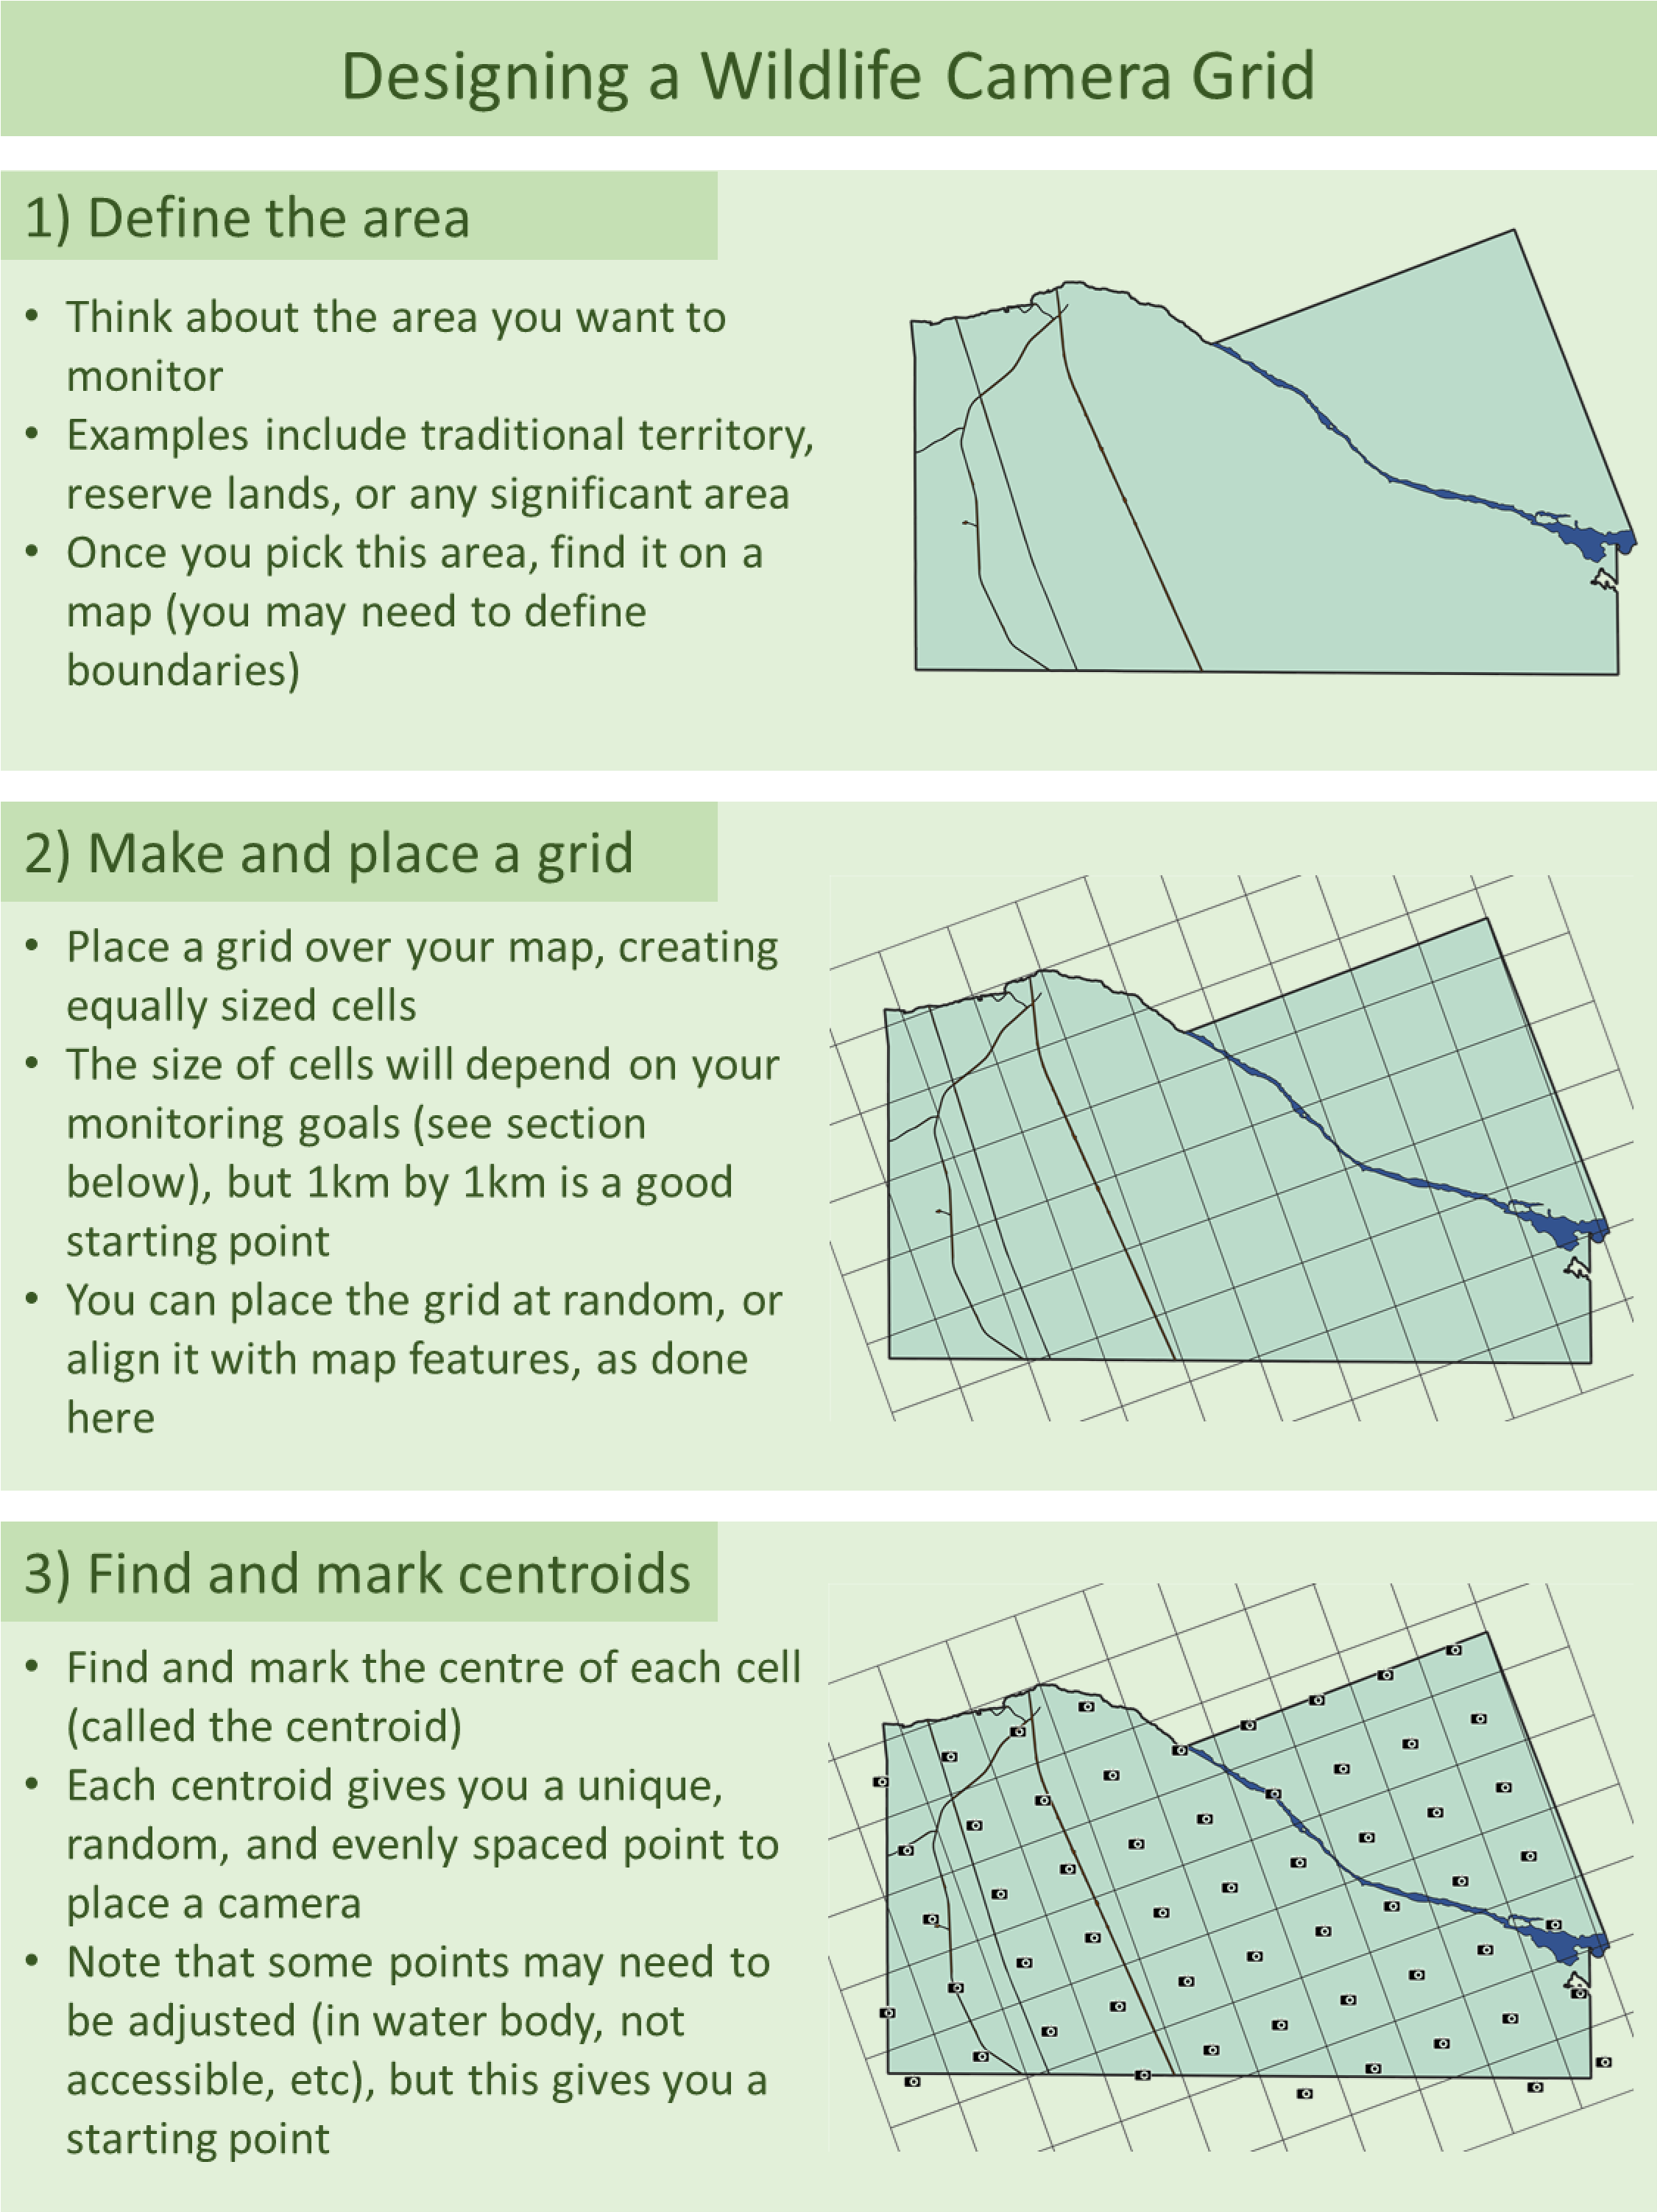
Systematic random – camera locations are selected using a two-stage approach. Firstly, grids are selected systematically (to occur within a regular pattern) across the study area. The location of the camera within each grid is then selected randomly. This method is similar to the design. The same advantages apply in terms of unbiased landscape representation, and the same modelling approachescan be used. The disadvantage of using a (or design) is that rare habitat types may be missed.
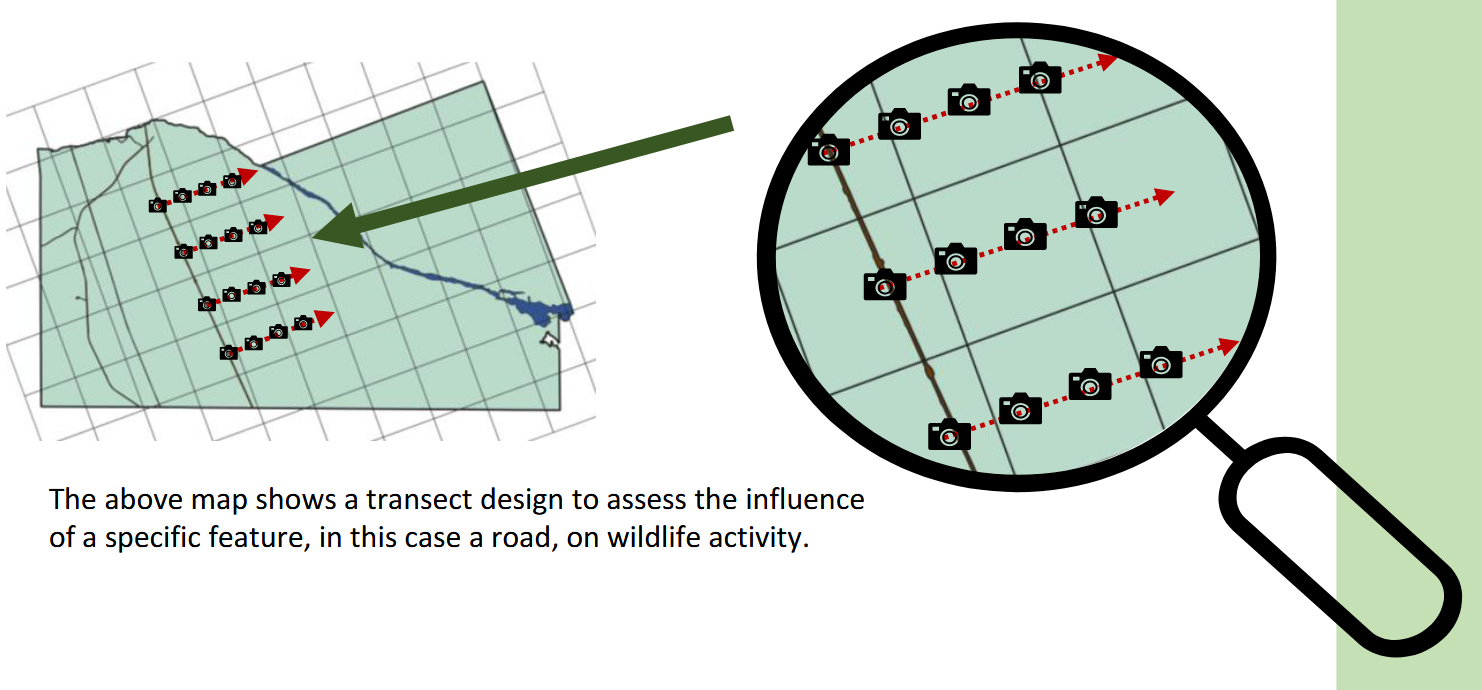
Systematic non-random design – sets of cameras can be deployed within a systematic non-random approach (i.e., “systematic clustered” or “systematic paired”) to assess the effects of disturbance along a gradient, over time, at multiple scales and/or with control (i.e., reference) sample stations. Hierarchical Before-After Dose-Response (BADR) is one such method that requires cameras to be placed within a systematic non-random approach, where camera locations occur along transects or in arrays (sample stations), selected using a nested spatial hierarchy of sampling to control for variability in land-use type and large-scale patterns (). The study area is divided into land-use regions based on land-use type, then into landscape units, which are assessed for environmental variability to determine where sample stations should be placed (). The “Before-After” component of BADR incorporates the phase of stressors (i.e., proposed or current development) (). The “Dose-Response” component of BADR controls for the variable distribution of activity (and the potential impacts) by incorporating control (or reference) sample stations and/or by placing cameras in sample stations along a gradient of disturbance ().
Stratified
Stratified random design (Figure 3c) – the area of interest is divided into smaller strata (e.g., habitat type, disturbance levels), and then a proportional random sample of sites is selected within each (e.g., 15%, 35% and 50% of sites within high, medium and low disturbance strata). This design can help ensure that the sample adequately reflects the major or uncommon strata of interest and may be an efficient approach when users are limited by accessibility constraints (Wearn & Glover-Kapfer, 2017). This design can also be used to increase precision if animal densities are known to be highly variable (Junker et al., 2021) or when a species is expected to occur in certain habitat types more often (Gillespie et al., 2015). For example, studies that wish to assess species richness, or occupancy rates for a particular species, amongst strata would use a design.
Clustered / Paired
Clustere design (Figure 3d) – multiple cameras are deployed at a sample station. The distance between cameras (camera spacing) will be influenced by the chosen sampling design, the Survey Objective, the Target Species and data analysis. A can be used within a systematic or stratified approach (i.e., systematic clustered design or as a clustered random design) (Wearn & Glover-Kapfer, 2017). A is common when users are interested in individual identification, such as density estimation from marked or partially marked populations (e.g., [spatially explicit capture-recapture ; Borchers & Efford, 2008; Efford, 2004; Royle & Young, 2008] or [spatial mark-resight SMR; Doran-Myers, 2018]). A design can also be used in an occupancy framework (O’Connell & Bailey, 2011; Pacifici et al., 2016) when interested in measures of species richness (O’Brien et al., 2011).
A design can be a cost-efficient approach to increase the number of replicates at each site (especially when accessibility is limiting; Gálvez et al., 2016) and to reduce measurement error and improve precision (Clarke et al., 2019). However, spatial autocorrelation may occur with this design (Moqanaki et al., 2021), depending on the camera spacing.
Cluster Sampling (Hines et al. 2010): https://doi.org/10.1890/09-0321.1
Paired design – a form of “” where two cameras that are placed closely together to increase detection probability (“paired cameras”), to evaluate certain conditions (“paired sites,” e.g., on- or off trails), etc. Paired placements can help to account for other variability that might occur (i.e., variation in habitat quality). For some , pairs of cameras might be considered subsamples within another sampling design (e.g., , stratified random, systematic).
Targeted
Targeted design – cameras are placed in areas that are known or suspected to have higher activity levels (e.g., game trails, mineral licks, etc.). This design is useful when monitoring rare or cryptic species that are unlikely to be detected with other designs. This design is commonly used when estimating densities of populations (e.g., [spatially explicit capture-recapture ; Borchers & Efford, 2008; Efford, 2004; Royle & Young, 2008]) or behaviour studies. It is, however, important to understand that sampling may impede one’s ability to make inferences beyond the survey area. For some , sampling may be used within another sampling design (e.g., a sample of game trails and seismic lines; Keim et al., 2021).
Convenience
Convenience design – camera locations or sample stations are chosen based on logistic considerations (e.g., remoteness, access constraints, costs). When cost is a key consideration, other more rigorous sampling designs (e.g., stratified; Van Wilgenburg et al., 2020) that can incorporate cost should be considered first. One should be cautious when generalizing or drawing conclusions from data collected using , given that estimates can be biased if the sample poorly represents the population of interest. The design can be used where the goal is to survey a specific location(s) without the intent to generalize to un-surveyed areas (Gillespie et al., 2015; e.g., Kusi et al., 2020) or to survey an area following a report of the occurrence of a rare species. Both randomized (e.g., Found & Patterson, 2020) or approaches can be used within a approach, although the user should still be cautious about extrapolating inferences to areas (or habitat types in an occupancy framework [MacKenzie et al., 2002]) that were not sampled and, therefore, not represented in the data (Gillespie et al., 2015).
This section will be available soon! In the meantime, check out the information in the other tabs!
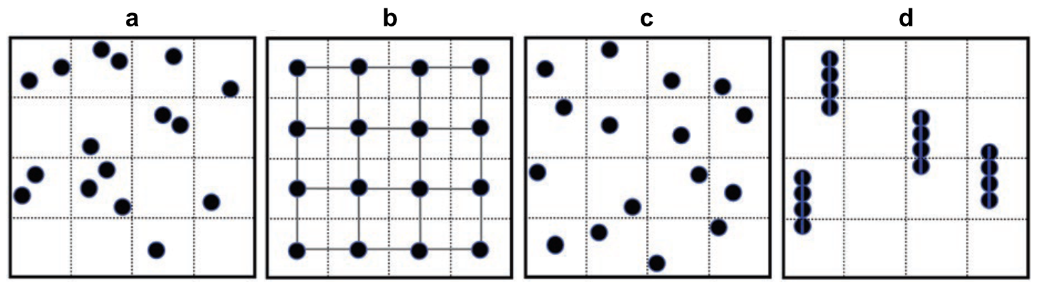
RCSC et al., 2024a - Fig. 3 Examples of sampling designs: (a) simple random, (b) systematic, (c) stratified (each grid cell is a stratum), and (d) clustered (adapted from Schweiger, 2020).
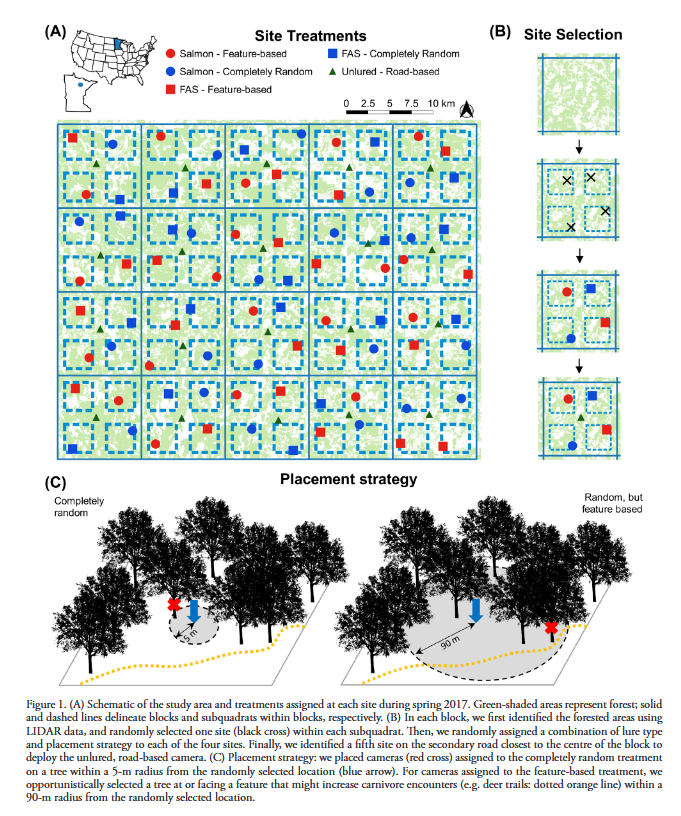
Iannarilli et al., 2021 - Fig.1 Schematic of the study area and treatments assigned at each site during spring 2017. Green-shaded areas represent forest; solid and dashed lines delineate blocks and subquadrats within blocks, respectively. (B) In each block, we first identified the forested areas using LIDAR data, and randomly selected one site (black cross) within each subquadrat. Then, we randomly assigned a combination of lure type and placement strategy to each of the four sites. Finally, we identified a fifth site on the secondary road closest to the centre of the block to deploy the unlured, road-based camera. (C) Placement strategy: we placed cameras (red cross) assigned to the completely random treatment on a tree within a 5-m radius from the randomly selected location (blue arrow). For cameras assigned to the feature-based treatment, we opportunistically selected a tree at or facing a feature that might increase carnivore encounters (e.g. deer trails: dotted orange line) within a 90-m radius from the randomly selected location.
Type |
Name |
Note |
URL |
Reference |
|---|
Borchers, D. L., & Efford, M. G. (2008). Spatially Explicit Maximum Likelihood Methods for Capture-Recapture Studies. Biometrics, 64(2), 377-385. https://doi.org/10.1111/j.1541-0420.2007.00927.x
Burton, A. C., Neilson, E., Moreira, D., Ladle, A., Steenweg, R., Fisher, J. T., Bayne, E., Boutin, S., & Stephens, P. (2015). Camera trap Trapping: A Review and Recommendations for Linking Surveys to Ecological Processes. Journal of Applied Ecology, 52(3), 675-685. https://doi.org/10.1111/1365-2664.12432
Cusack, J., Dickman, A. J., Rowcliffe, J. M., Carbone, C., Macdonald, D. W., & Coulson, T. (2015). Random versus Game Trail-based Camera trap Placement Strategy for Monitoring Terrestrial Mammal Communities. PloS One,10(5), e0126373. https://doi.org/10.1371/journal.pone.0126373
Efford, M. (2004). Density Estimation in Live-Trapping Studies. Oikos, 106(3), 598-610. http://www.jstor.org.login.ezproxy.library.ualberta.ca/stable/3548382
Fisher, J. T., & Burton, C. (2012). Monitoring Mammals in Alberta: Recommendations for Remote Camera Trapping. Alberta Innovates - Technology Futures & Alberta Biodiversity Monitoring Institute. https://doi.org/0.13140/RG.2.1.3944.3680
Found, R., & Patterson, B. R. (2020). Assessing Ungulate Populations in Temperate North America. Canadian Wildlife Biology and Management, 9(1), 21-42. https://cwbm.ca/wp-content/uploads/2020/05/Found-Patterson.pdf
Gillespie, G. R., Brennan, K., Gentles, T., Hill, B., Low Choy, J., Mahney, T., Stevens, A., & Stokeld, D. (2015). A Guide for the use of Remote Cameras for Wildlife Survey in Northern Australia. Darwin: Charles Darwin University. https://nesplandscapes.edu.au/wp-content/uploads/2015/10/5.2.4_a_guide_to_use_of_remote_cameras_for_wildlife_Surveys_final_web2.pdf
Kemp, C., Yarchuk, K., Menzies, A., & Popp, J. (2022). A Guide to Using Wildlife Cameras for Ecological Monitoring in a Community-based Context. WISE Lab. https://wildcams.ca/site/assets/files/1386/cbm_wildlife_camera_guide-_aug2022.pdf
MacKenzie, D. I., Nichols, J. D., Lachman, G. B., Droege, S., Royle, J. A., & Langtimm, C. A. (2002). Estimating Site Occupancy Rates When Detection Probabilities Are Less Than One. Ecology, 83(8), 2248-2255. https://doi.org/10.2307/3072056
O’Connell, A. F., Talancy, N. W., Bailey, L. L., Sauer, J. R., Cook, R., & Gilbert, A. T. (2006). Estimating Site Occupancy and Detection Probability Parameters for Meso- And Large Mammals in a Coastal Ecosystem. Journal of Wildlife Management, 70(6), 1625-1633. https://doi.org/10.2193/0022-541X(2006)70[1625:ESOADP]2.0.CO;2
Rovero, F., Zimmermann, F., Berzi, D., & Meek, P. (2013). “Which camera trap type and how many do I need?” A review of camera features and study designs for a range of wildlife research applications. Hystrix, the Italian Journal of Mammalogy, 24(2), 148-156. https://doi.org/10.4404/hystrix-24.2-6316
Royle, J. A., & Young, K. V. (2008). A hierarchical model for spatial capture-recapture data. Ecology, 89(8), 2281-2289. https://doi.org/10.1890/07-0601.1
Van Wilgenburg, S. L., Mahon, C. L., Campbell, G., McLeod, L., Campbell, M., Evans, D., Easton, W., Francis, C. M., Hache, S., Machtans, C. S., Mader, C., Pankratz, R. F., Russell, R., Smith, A. C., Thomas, P., Toms, J. D., & Tremblay, J. A. (2020). A Cost Efficient Spatially Balanced Hierarchical Sampling Design for Monitoring Boreal Birds Incorporating Access Costs and Habitat Stratification. PLoS ONE, 15(6). https://journals.plos.org/plosone/article?id=10.1371/journal.pone.0234494