Capture-recapture (CR) / Capture-mark-recapture (CMR)#
Assumptions, Pros, Cons
Demographic closure (i.e., no births or deaths) (Wearn & Glover-Kapfer, 2017)
Geographic closure (i.e., no immigration or emigration) (Wearn & Glover-Kapfer, 2017)
All individuals have at least some probability of being detected (Rovero et al., 2013)
Sampled area encompasses the full extent of individuals’ movements (Karanth & Nichols, 1998; Rovero et al., 2013)
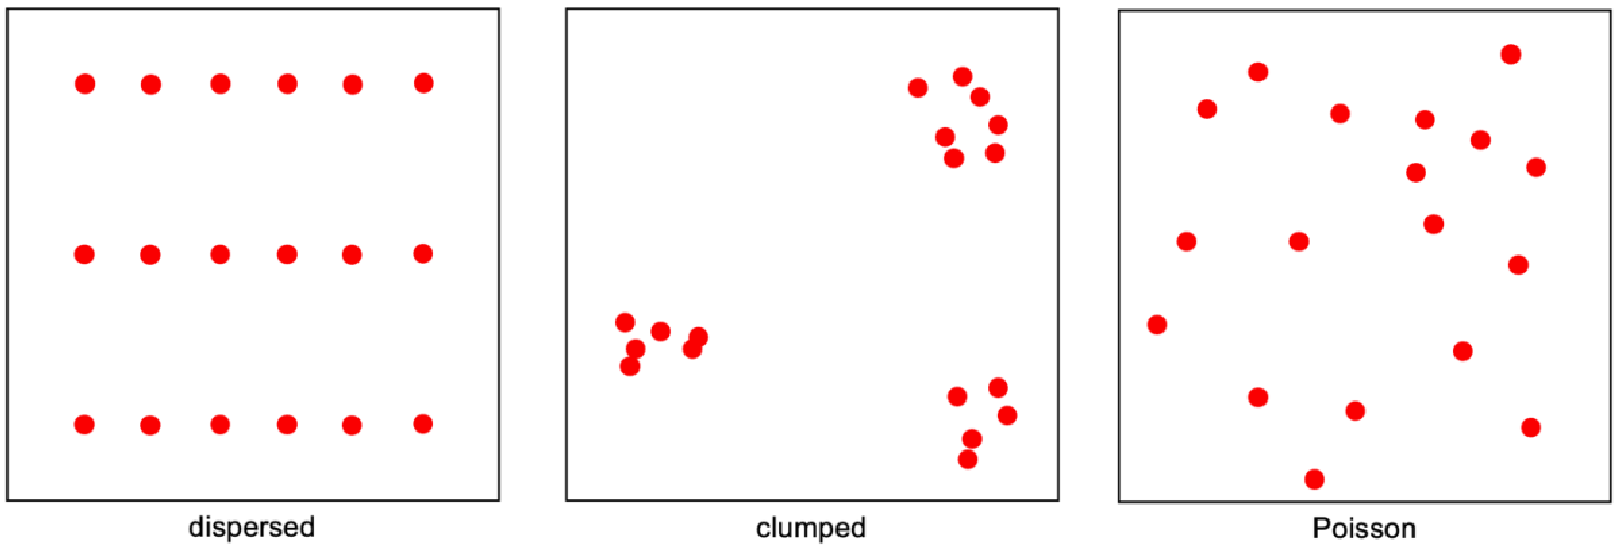
Activity centres are randomly dispersed (Clarke et al., 2023)
Activity centres are stationary (Clarke et al., 2023)
May be used as a relative abundance index that controls for imperfect detection (Wearn & Glover-Kapfer, 2017)
Easy-to-use software exists to implement (e.g., CAPTURE)Wearn & Glover-Kapfer, 2017)
Can use the robust design with ‘open’ models to obtain recruitment and survival rate estimates (Wearn & Glover-Kapfer, 2017)
Requires that individuals are distinguishable (Wearn & Glover-Kapfer, 2017). However, CR (; Rovero et al., 2013; Karanth & Nichols, 1998) has also been used to estimate abundance of species that lack natural markers but that have phenotypic and*/or environment-induced characteristics (Noss et al., 2003; Kelly et al., 2008; Rovero et al., 2013)
When the sample size is large enough to reliably estimate density with CR, (Karanth, 1995; Karanth & Nichols, 1998) individuals are unlikely to have a unique marker (Noss et al., 2003; Kelly et al., 2008; Rovero et al., 2013)
Dependent on the surveyed area, which is difficult to track and calculate (Wearn & Glover-Kapfer, 2017)
Requires a minimum number of captures and recaptures (Wearn & Glover-Kapfer, 2017)
Relatively stringent requirements for study design (e.g., no ‘holes’ in the trapping grid) (Wearn & Glover-Kapfer, 2017)
Geographic closure at the plot level, which is often unrealistic (Wearn & Glover-Kapfer, 2017) has also been used to estimate abundance of species that lack natural markers but that have phenotypic and*/or environment-induced characteristics (Noss et al., 2003; Kelly et al., 2008; Rovero et al., 2013)
Assumes a specific relationship between abundance and detection (Wearn & Glover-Kapfer, 2017)
density cannot be explicitly estimated because the true area animals occupy is never measured (only approximated) (Chandler & Royle, 2013)
This section will be available soon! In the meantime, check out the information in the other tabs!
Note
This content was adapted from: The Density Handbook, “Using Camera Traps to Estimate Medium and Large Mammal Density: Comparison of Methods and Recommendations for Wildlife Managers” (Clarke et al., 2023)
Of all the modelling frameworks discussed in this document, capture-recapture (CR) also called capture-mark-recapture or mark-recapture – is perhaps the most wellknown. Since the 19th century, CR has been used to measure population size by capturing, marking, releasing and recapturing individuals (Le Cren, 1965, Otis et al., 1978). For species or populations that are challenging to physically trap and mark, CR can also be applied to DNA, acoustic and camera trap data (Royle et al., 2014). Here, we will discuss camera trap CR.
Clarke et al. (2023) - Fig. 11 Adapted from Royle (2020). A detection history matrix for an example population. For each individual (1 through 𝑛) during each sampling occasion (1 through 𝐾), a value of 1 is assigned if that individual was detected at a camera trap and a value of 0 is assigned if it was not detected at a camera trap. Note that we do not detect individuals 𝑛 + 1, 𝑛 + 2…𝑁 (0s for every sampling occasion), but they are still present and able to be detected.
To estimate density using camera trap CR, we must first estimate population size 𝑁. CR models use individuals’ detection histories – that is, the record of when each individual was photographed or not photographed (i.e., (re)captured or not (re)captured) – to solve for 𝑁 (Figure 3; Royle, 2020). Population-level detection histories look like a matrix of 1s and 0s, where 1s signify that an individual was captured during a given sampling occasion 𝑘, and 0s signify that the individual was not captured during that occasion (Royle, 2020, Royle et al., 2014). The number of individuals photographed at least once over the course of the study (i.e., the count of animals captured) is 𝑛.
Importantly, the count of animals is not the same as the size of the population (i.e., 𝑛 ≠ 𝑁). Some individuals will never be photographed during a study, even though they are present and able to be detected (i.e., they are in 𝑁 but not in 𝑛; Royle, 2020). Using the matrix of detection histories, we must therefore calculate the likelihood animals will be detected by an array of camera traps – that is, detection probability p (Royle, 2020).
Taking this information together, we can calculate population size 𝑁 as:
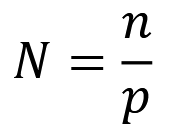
which is often referred to as the canonical estimator of population size (Royle, 2020). Population size 𝑁 can then be divided by an estimate of the area of the sampling frame 𝐴 to obtain density.
CR models have important limitations – notably that they do not consider the spatial configuration of camera traps or the spatial pattern of animal detections. This gives rise to two major issues:
The sampling frame 𝐴 is not known (Chandler & Royle, 2013). In other words: the true area animals occupy is never measured, only approximated using adhoc approaches (e.g., using a buffer strip around the trap array; Rich et al., 2014, Sollmann et al., 2018). Consequently, density cannot be calculated explicitly (Chandler & Royle, 2013), and CR-derived density estimates are somewhat arbitrary and difficult to compare across studies (Green et al., 2020, Royle et al., 2014, Sollmann et al., 2018).
Detection probability is assumed to be the same across all individuals and sampling occasions, even though the likelihood a given individual is detected at a given camera trap will change with its proximity to that trap. An animal that occupies territory far away from a trap is less likely to be detected there than one that lives nearby, for example (Morin et al., 2022).
The standard CR model has largely been phased out with the advent of spatially-explicit CR models (see Spatial capture-recapture (SCR) / Spatially explicit capture recapture (SECR)); Burton et al., 2015, Sollmann et al., 2018), which address the shortcomings of CR and have been shown to produce more accurate density estimates (e.g., Blanc et al., 2013, Obbard et al., 2010, Sollmann et al., 2011).
Clarke et al. (2023) – Fig. 3 Adapted from Royle (2020). A detection history matrix for an example population.
For each individual (1 through 𝑛) during each sampling occasion (1 through 𝐾), a value of 1 is assigned if that individual was detected at a camera trap and a value of 0 is assigned if it was not detected at a camera trap. Note that we do not detect individuals 𝑛 + 1, 𝑛 + 2…𝑁 (0s for every sampling occasion), but they are still present and able to be detected.
Check back in the future!
Type |
Name |
Note |
URL |
Reference |
|---|---|---|---|---|
MARK |
||||
CAPTURE |
https://www.mbr-pwrc.usgs.gov/software/capture.shtml resource2_url |
|||
R package |
‘multimark’: Capture-Mark-Recapture Analysis using Multiple Non-Invasive Marks |
Linked package version 2.1.6 updated as of 2023 |
https://cran.r-project.org/web/packages/multimark/index.html |
Blanc, L., Marboutin, E., Gatti, S., & Gimenez, O. (2013). Abundance of Rare and Elusive Species: Empirical Investigation of Closed versus Spatially Explicit Capture-Recapture Models with Lynx as a Case Study. Journal of Wildlife Management, 77(2), 372-78. https://doi.org/10.1002/jwmg.453
Burton, A. C., Neilson, E., Moreira, D., Ladle, A., Steenweg, R., Fisher, J. T., Bayne, E., Boutin, S., & Stephens, P. (2015). Camera trap Trapping: A Review and Recommendations for Linking Surveys to Ecological Processes. Journal of Applied Ecology, 52(3), 675-685. https://doi.org/10.1111/1365-2664.12432
Chandler, R. B., & Royle, J. A. (2013). Spatially explicit models for inference about Density in unmarked or partially marked populations. The Annals of Applied Statistics, 7(2), 936-954. https://doi.org/10.1214/12-aoas610
Clarke, J., Bohm, H., Burton, C., Constantinou, A. (2023). Using Camera Traps to Estimate Medium and Large Mammal Density: Comparison of Methods and Recommendations for Wildlife Managers. https://doi.org/10.13140/RG.2.2.18364.72320
Green, A. M., Chynoweth, M. W., & Şekercioğlu, Ç. H. (2020). Spatially Explicit Capture-Recapture Through Camera Trapping: A Review of Benchmark Analyses for Wildlife Density Estimation. Frontiers in Ecology and Evolution, 8, Article 563477. https://doi.org/10.3389/fevo.2020.563477
Le Cren, E. D. (1965). A Note on the History of Mark-Recapture Population Estimates. The Journal of Animal Ecology, 34(2),453-54. https://doi.org/10.2307/2661
Obbard, M. E., Howe, E. J., & Kyle, C. J. (2010). Empirical Comparison of Density Estimators for Large Carnivores. Journal of Applied Ecology, 47(1), 76-84. https://doi.org/10.1111/j.1365-2664.2009.01758.x
Otis, D. L., Burnham, K. P., White, G. C.. & Anderson, D. R. (1978). Statistical Inference from Capture Data on Closed Animal Populations. Wildlife Monographs, 62, 3-135. https://pubs.usgs.gov/publication/70119899
Morin, D. J., Boulanger, J., Bischof, R., Lee, D. C., Ngoprasert, D., Fuller, A. K., McLellan, B., Steinmetz, R., Sharma, S., Garshelis, D., Gopalaswamy, A., Nawaz, M. A., & Karanth, U. (2022).comparison of methods for estimating Density and population trends for low-Density Asian bears. Global Ecology and Conservation, 35, e02058 https://doi.org/10.1016/j.gecco.2022.e02058
Rich, L. N., Kelly, M. J., Sollmann, R., Noss, A. J., Maffei, L., Arispe, R. L., Paviolo, A., De Angelo, C. D., Di Blanco, Y. E., & Di Bitetti, M. S. (2014).comparing capture-recapture, mark-resight, and spatial mark-resight models for estimating puma densities via camera traps. Journal of Mammalogy, 95(2), 382-391. https://doi.org/10.1644/13-mamm-a-126
Royle, J. A., Converse, S. J., & Freckleton, R. (2014). Hierarchical spatial capture-recapture models: modelling population Density in stratified populations. Methods in Ecology and Evolution, 5(1), 37-43. https://doi.org/10.1111/2041-210x.12135
Royle, A. J. (2020, Oct 26) Introduction to Spatial Capture-Recapture. oSCR Package, [Video]. YouTube. https://www.youtube.com/watch?v=yRRDi07FtPg
Sollmann, R. (2018). A gentle introduction to camera‐trap data analysis. African Journal of Ecology, 56, 740-749. https://doi.org/10.1111/aje.12557
Sollmann, R., Furtado, M. M., Gardner, B., Hofer, H., Jácomo, A. T. A., Tôrres, N. M., & Silveira, L. (2011). Improving Density Estimates for Elusive Carnivores: Accounting for Sex-Specific Detection and Movements Using Spatial Capture-Recapture Models for Jaguars in Central Brazil. Biological Conservation, 144(3), 1017-24. https://doi.org/10.1016/j.biocon.2010.12.011