Spatial mark-resight #
Assumptions, Pros, Cons
Demographic closure (i.e., no births or deaths) (Chandler & Royle, 2013; Clarke et al., 2023)
Geographic closure (i.e., no immigration or emigration) (Chandler & Royle, 2013; Clarke et al., 2023)
Individuals do not lose marks (Wearn & Glover-Kapfer, 2017) (for maximum precision), but SMR (Chandler & Royle, 2013; Sollmann et al., 2013a; Sollmann et al., 2013b)) does allow for inclusion of marked but unidentified resighting detections (Sollmann et al., 2013b; Rich et al., 2014)
Individuals are not misidentified (Wearn & Glover-Kapfer, 2017)
Failure to identify marked individuals is random (Whittington et al., 2018; Clarke et al., 2023)
Marked animals are a random sample of the population with home ranges located inside the state space (Sollmann et al., 2013a; Rich et al., 2014)
Detections are independent (Chandler & Royle, 2013; Clarke et al., 2023)
Individuals have equal Detection probability at a given distance from the centre of their home range (Wearn & Glover-Kapfer, 2017)
Detections of different individuals are independent (Wearn & Glover-Kapfer, 2017)
Movement is unaffected by the cameras (Wearn & Glover-Kapfer, 2017)
Behaviour is unaffected by cameras and marking (Wearn & Glover-Kapfer, 2017)
Camera locations are randomly placed relative to the distribution and orientation of home ranges (Wearn & Glover-Kapfer, 2017)
Camera locations are close enough together that animals are detected at multiple cameras (Chandler & Royle, 2013; Clarke et al., 2023)
Surveys are independent (Wearn & Glover-Kapfer, 2017)
Home ranges are stable (Wearn & Glover-Kapfer, 2017)
Distribution of home range centres follows a defined distribution (Poisson, or other, e.g., negative binomial) (Wearn & Glover-Kapfer, 2017)
Animals’ activity centres are randomly dispersed (Chandler & Royle, 2013; Clarke et al., 2023)
Estimates are fully comparable to SECR (Efford, 2004; Borchers & Efford, 2008; Royle & Young, 2008; Royle et al., 2009) of marked species (Wearn & Glover-Kapfer, 2017)
Can be applied to a broader range of species than SECR [(Efford, 2004; Borchers & Efford, 2008; Royle & Young, 2008; Royle et al., 2009) (Wearn & Glover-Kapfer, 2017)
Allows researcher to take advantage of natural markings (Wearn & Glover-Kapfer, 2017)
Allows researcher to mark a subset of the population (note - precision is dependent on number of marked individuals in a population) (Wearn & Glover-Kapfer, 2017)
Animals may have to be physically captured and marked if natural marks do not exist on enough individuals (Wearn & Glover-Kapfer, 2017)
All individuals must be identifiable (Wearn & Glover-Kapfer, 2017)
Allows for density estimation for a unmarked population, but the precision of the density estimates are likely to be very low value (Wearn & Glover-Kapfer, 2017)
Remains poorly tested with camera data, although it offers promise (Wearn & Glover-Kapfer, 2017)
density estimates are likely less precise than with SECR (Efford, 2004; Borchers & Efford, 2008; Royle & Young, 2008; Royle et al., 2009) or REM, unless a large proportion of the population has marks (Wearn & Glover-Kapfer, 2017)
Requires sampling points to be close enough that individuals encounter multiple cameras (Wearn & Glover-Kapfer, 2017)
This section will be available soon! In the meantime, check out the information in the other tabs!
Note
This content was adapted from: The Density Handbook, “Using Camera Traps to Estimate Medium and Large Mammal Density: Comparison of Methods and Recommendations for Wildlife Managers” (Clarke et al., 2023)
We have already discussed spatially-explicit density models for completely marked populations (spatial capture-recapture, SCR; see Spatial capture-recapture (SCR) / Spatially explicit capture recapture (SECR) ) and completely unmarked populations (spatial count, SC; see Spatial count) – but what about the “intermediate” situation, in which only a fraction of a population carries marks? Spatial mark-resight (SMR) models were developed for such scenarios.
First, let’s familiarize ourselves with non-spatial mark-resight models (or simply markresight models). Mark-resight models are similar to capture-recapture (CR; see Capture-recapture (CR) / Capture-mark-recapture (CMR)) models, but relax CR’s stipulation that all animals in a study population are individually identifiable – that is, that all animals carry unique natural marks, or that all animals are trapped and tagged (Royle et al., 2014; Sollmann et al., 2013a). Instead, mark-resight models need only a subset of the population to be marked (either naturally or from a single trapping-and-tagging event; Sollmann et al., 2013a). The entire population is then resighted using a “non-invasive” survey technique (i.e., a method that does not require the handling of animals, like an aerial or camera trap survey; Royle et al., 2014, Sollmann et al., 2013a) and population size is calculated using the equation:
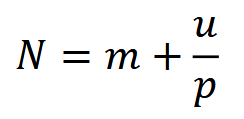
where 𝑚 is the number of marked animals, 𝑢 is the number of unmarked animals and 𝑝 is detection probability – the latter of which is determined using data from marked individuals only (Chandler & Royle, 2013). Dividing 𝑁 by the area of the sampling frame 𝐴 produces an estimate of total population density.
SMR models integrate spatial information into the mark-resight framework. The result is a hybrid model that combines data from the detection histories of marked individuals, as per SCR, with site-specific counts of unmarked individuals, as per SC (Royle et al., 2014). For the remainder of this section, we will discuss camera trap SMR, for which animals are resighted using camera trap arrays.
The first SMR model, developed by Chandler and Royle (2013) and Sollmann et al. (2013a) and now coined “conventional SMR,” models the resighting process only (i.e., ignores the marking process; Whittington et al., 2018). In doing so, conventional SMR makes the implicit assumption that marked animals are a random subset of the study population, and thus that 1) marked and unmarked animals are distributed similarly across the landscape, and 2) marked and unmarked animals have equal detection probabilities (Royle et al., 2014; Whittington et al., 2018). Such assumptions can hold – for example, when a random subset of the population carries natural marks, or when a closed population of animals is trapped and tagged at random locations (Sollmann et al., 2013a; Rich et al., 2014; Whittington et al., 2018). These assumptions are violated, however, when animals are trapped and tagged non-randomly (e.g., owing to inaccessibility, rough terrain) before resighting, since the distribution of marked animals will be clustered around trapping-and-tagging sites, and marked animals will have a higher chance of being detected at camera traps near where they were tagged (Whittington et al., 2018).
To ease the assumptions and address the limitations of conventional SMR, Whittington et al. (2018) developed generalized SMR, which models the marking and resighting processes separately. The marking sub-model describes where animals were trapped and tagged on the study landscape – that is, how marked individuals are distributed in space (Jiménez et al., 2021). Explicitly modelling the marking process allows practitioners to trap and tag animals non-randomly (e.g., using linear or grid trap layouts) without biasing density estimates (Whittington et al., 2018). The resighting submodel combines marked individuals’ detection histories, camera trap-specific counts of unmarked individuals and estimates of detection probability to determine population density (Whittington et al., 2018).
Practitioners should note that the number of marked animals in a population can influence the precision of SMR studies. The general trend in precision, based on previous SMR studies (both conventional and generalized), is: the more marked animals, the more precise the density estimation (see Whittington et al., 2018). Of the four studies compared, only those with 22 or more marked individuals achieved coefficients of variation (CVs) below the accepted threshold for wildlife management (i.e., CV ≤ 0.2; Sollmann et al., 2013a; Whittington et al., 2018; Williams et al., 2002).
Whittington et al. (2018) - Fig. 1 Differences in the distributions of marked and unmarked animals lead to bias in conventional SMR models but not generalized SMR models. (a) Animals (blue triangles) in the state-space are subject to trapping (+) and marking. (b) The expected distributions of marked and unmarked animals are assumed to be identical for conventional SMR models but depend on trap distribution for generalized SMR. (c) Marked and unmarked animals are observed during resight surveys. (d) The expected distribution of marked animals not resighted is incorrectly assumed to be highest near the edge of the state-space for conventional SMR, whereas generalized SMR models correctly assume it is highest closest to traps.
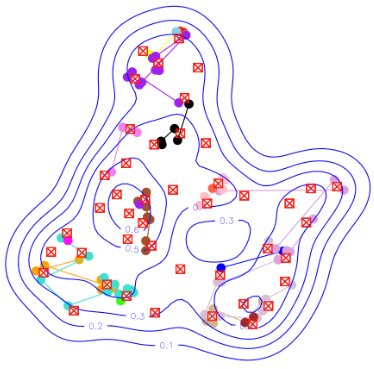
CREEM Mural (N.D.) - The Figure shows some leopard camera trap data and the contours of the resulting estimated probability of detecting an animal with activity centre anywhere in the survey region (blue lines). The red crosses are camera traps and the coloured dots are individual leopard captures, with captures of the same individual joined by lines.
Check back in the future!
Type |
Name |
Note |
URL |
Reference |
|---|
Chandler, R. B., & Royle, J. A. (2013). Spatially explicit models for inference about Density in unmarked or partially marked populations. The Annals of Applied Statistics, 7(2), 936-954. https://doi.org/10.1214/12-aoas610
Clarke, J., Bohm, H., Burton, C., Constantinou, A. (2023). Using Camera Traps to Estimate Medium and Large Mammal Density: Comparison of Methods and Recommendations for Wildlife Managers. https://doi.org/10.13140/RG.2.2.18364.72320
Jiménez, J., C. Augustine, B., Linden, D. W., B. Chandler, R., & Royle, J. A. (2021). Spatial capture-recapture with random thinning for unidentified encounters. Ecology and Evolution, 11, 1187-1198. https://doi.org/10.1002/ece3.7091
Sollmann, R., Gardner, B., Chandler, R. B., Shindle, D. B., Onorato, D. P., Royle, J. A., O’Connell, A. F., & Lukacs, P. (2013a). Using multiple data sources provides Density estimates for endangered Florida panther. Journal of Applied Ecology, 50(4), 961-968. https://doi.org/10.1111/1365-2664.12098
Rich, L. N., Kelly, M. J., Sollmann, R., Noss, A. J., Maffei, L., Arispe, R. L., Paviolo, A., De Angelo, C. D., Di Blanco, Y. E., & Di Bitetti, M. S. (2014).comparing capture-recapture, mark-resight, and spatial mark-resight models for estimating puma densities via camera traps. Journal of Mammalogy, 95(2), 382-391. https://doi.org/10.1644/13-mamm-a-126
Royle, J. A., Converse, S. J., & Freckleton, R. (2014). Hierarchical spatial capture-recapture models: modelling population Density in stratified populations. Methods in Ecology and Evolution, 5(1), 37-43. https://doi.org/10.1111/2041-210x.12135
Whittington, J., Hebblewhite, M., Chandler, R. B., & Lentini, P. (2018). Generalized spatial mark-resight models with an application to grizzly bears. Journal of Applied Ecology, 55(1), 157-168. https://doi.org/10.1111/1365-2664.12954
Williams, B. K., Nichols, J. D., & Conroy, M. J. (2002). Analysis and Management of Animal Populations: Modeling, Estimation, and Decision Making. Book, Whole. San Diego: Academic Press. https://go.exlibris.link/qSfqP9dC