Behaviour#
Assumptions, Pros, Cons
Assumptions vary depending on the behavioural metric (Wearn & Glover-Kapfer, 2017)
For studies of activity patterns and temporal interactions of species: activity level is the only factor determining detection rates; animals are active when camera detection rate reaches its maximum in daily cycle (Royle et al., 2014; Rovero & Zimmermann, 2016)
Can detect difficult to observe behaviours (i.e., boldness, or mating) (Bridges & Noss, 2011)
Long-term data on behavioural changes that would be difficult to obtain otherwise (i.e., time-limited human observers, or costly GPS collars) (Bridges & Noss, 2011)
Can monitor behaviour in response to specific locations (i.e., compost sites, which might be more difficult using GPS collars for example) (Rovero & Zimmermann, 2016)
Can evaluate interactions between species (Rovero & Zimmermann, 2016)
Behavioural metrics may not reflect the behavioural state (inferred) (Rovero & Zimmermann, 2016)
Biases associated with equipment (i.e., presence of the camera itself may change behaviour studied) (Rovero & Zimmermann, 2016)
Difficult to consider individual variation (Rovero & Zimmermann, 2016)
This section will be available soon! In the meantime, check out the information in the other tabs!
This section will be available soon! In the meantime, check out the information in the other tabs!
Caravaggi et al. (2017) - Fig. 1. Examples of animal behaviour captured by camera traps:
(A) Scent marking by an American black bear (Ursus americanus); (B) intraspecific competition in moose (Alces alces); (C) interspecific interactions between a European hare (Lepus europaeus; anti-predator response), a common buzzard (Buteo buteo; avoidance and attempted predation) and a hooded crow (Corvus cornix; anti-predator behaviour) captured on video (available at 10.6084/m9.figshare.4508369); (D) predation of a European rabbit (Oryctolagus cuniculus) by a red fox (Vulpes vulpes); (E) investigation of a squirrel feeding station by a pine marten (Martes martes); (F) nut caching by a grey squirrel (Sciurus carolinensis). Images provided by A.C. Burton (a, b), A. Caravaggi (c, d) and C.M.V. Finlay (e, f).
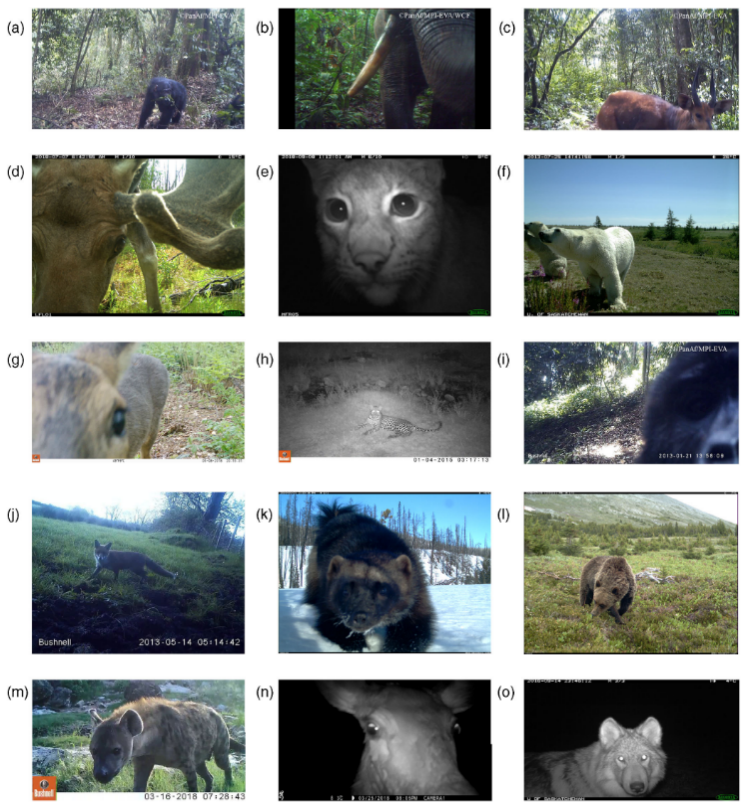
Caravaggi et al. (2020) - Fig 1. Examples of mammals detecting camera traps and/or olfactory cues associated with camera traps.
(a) Chimpanzee, Pan troglodytes; (b) African elephant, Loxodonta africana; (c) sitatunga, Tragelaphus spekii; (d) moose, Alces alces; (e) Eurasian lynx, Lynx lynx; (f) polar bear, Ursus maritimus; (g) roe deer, Capreolus capreolus; (h) African leopard, Panthera pardus; (i) mountain gorilla, Gorilla beringei; (j) red fox, Vulpes vulpes; (k) wolverine, Gulo gulo; (l) grizzly bear, Ursus arctos; (m) spotted hyena, Crocuta crocuta; (n) red deer, Cervus elaphus; (o) grey wolf, Canis lupus. Images provided by Ammie K. Kalan (a–c,i), T. R. H. (d,e), D. R. (f,o), S. G. (g,n), A. C. (h,j), J. T. F. (k,l), A. G. (m). Visit https://doi.org/10.6084/m9.figshare.c.4593902.v1 for selected source video.
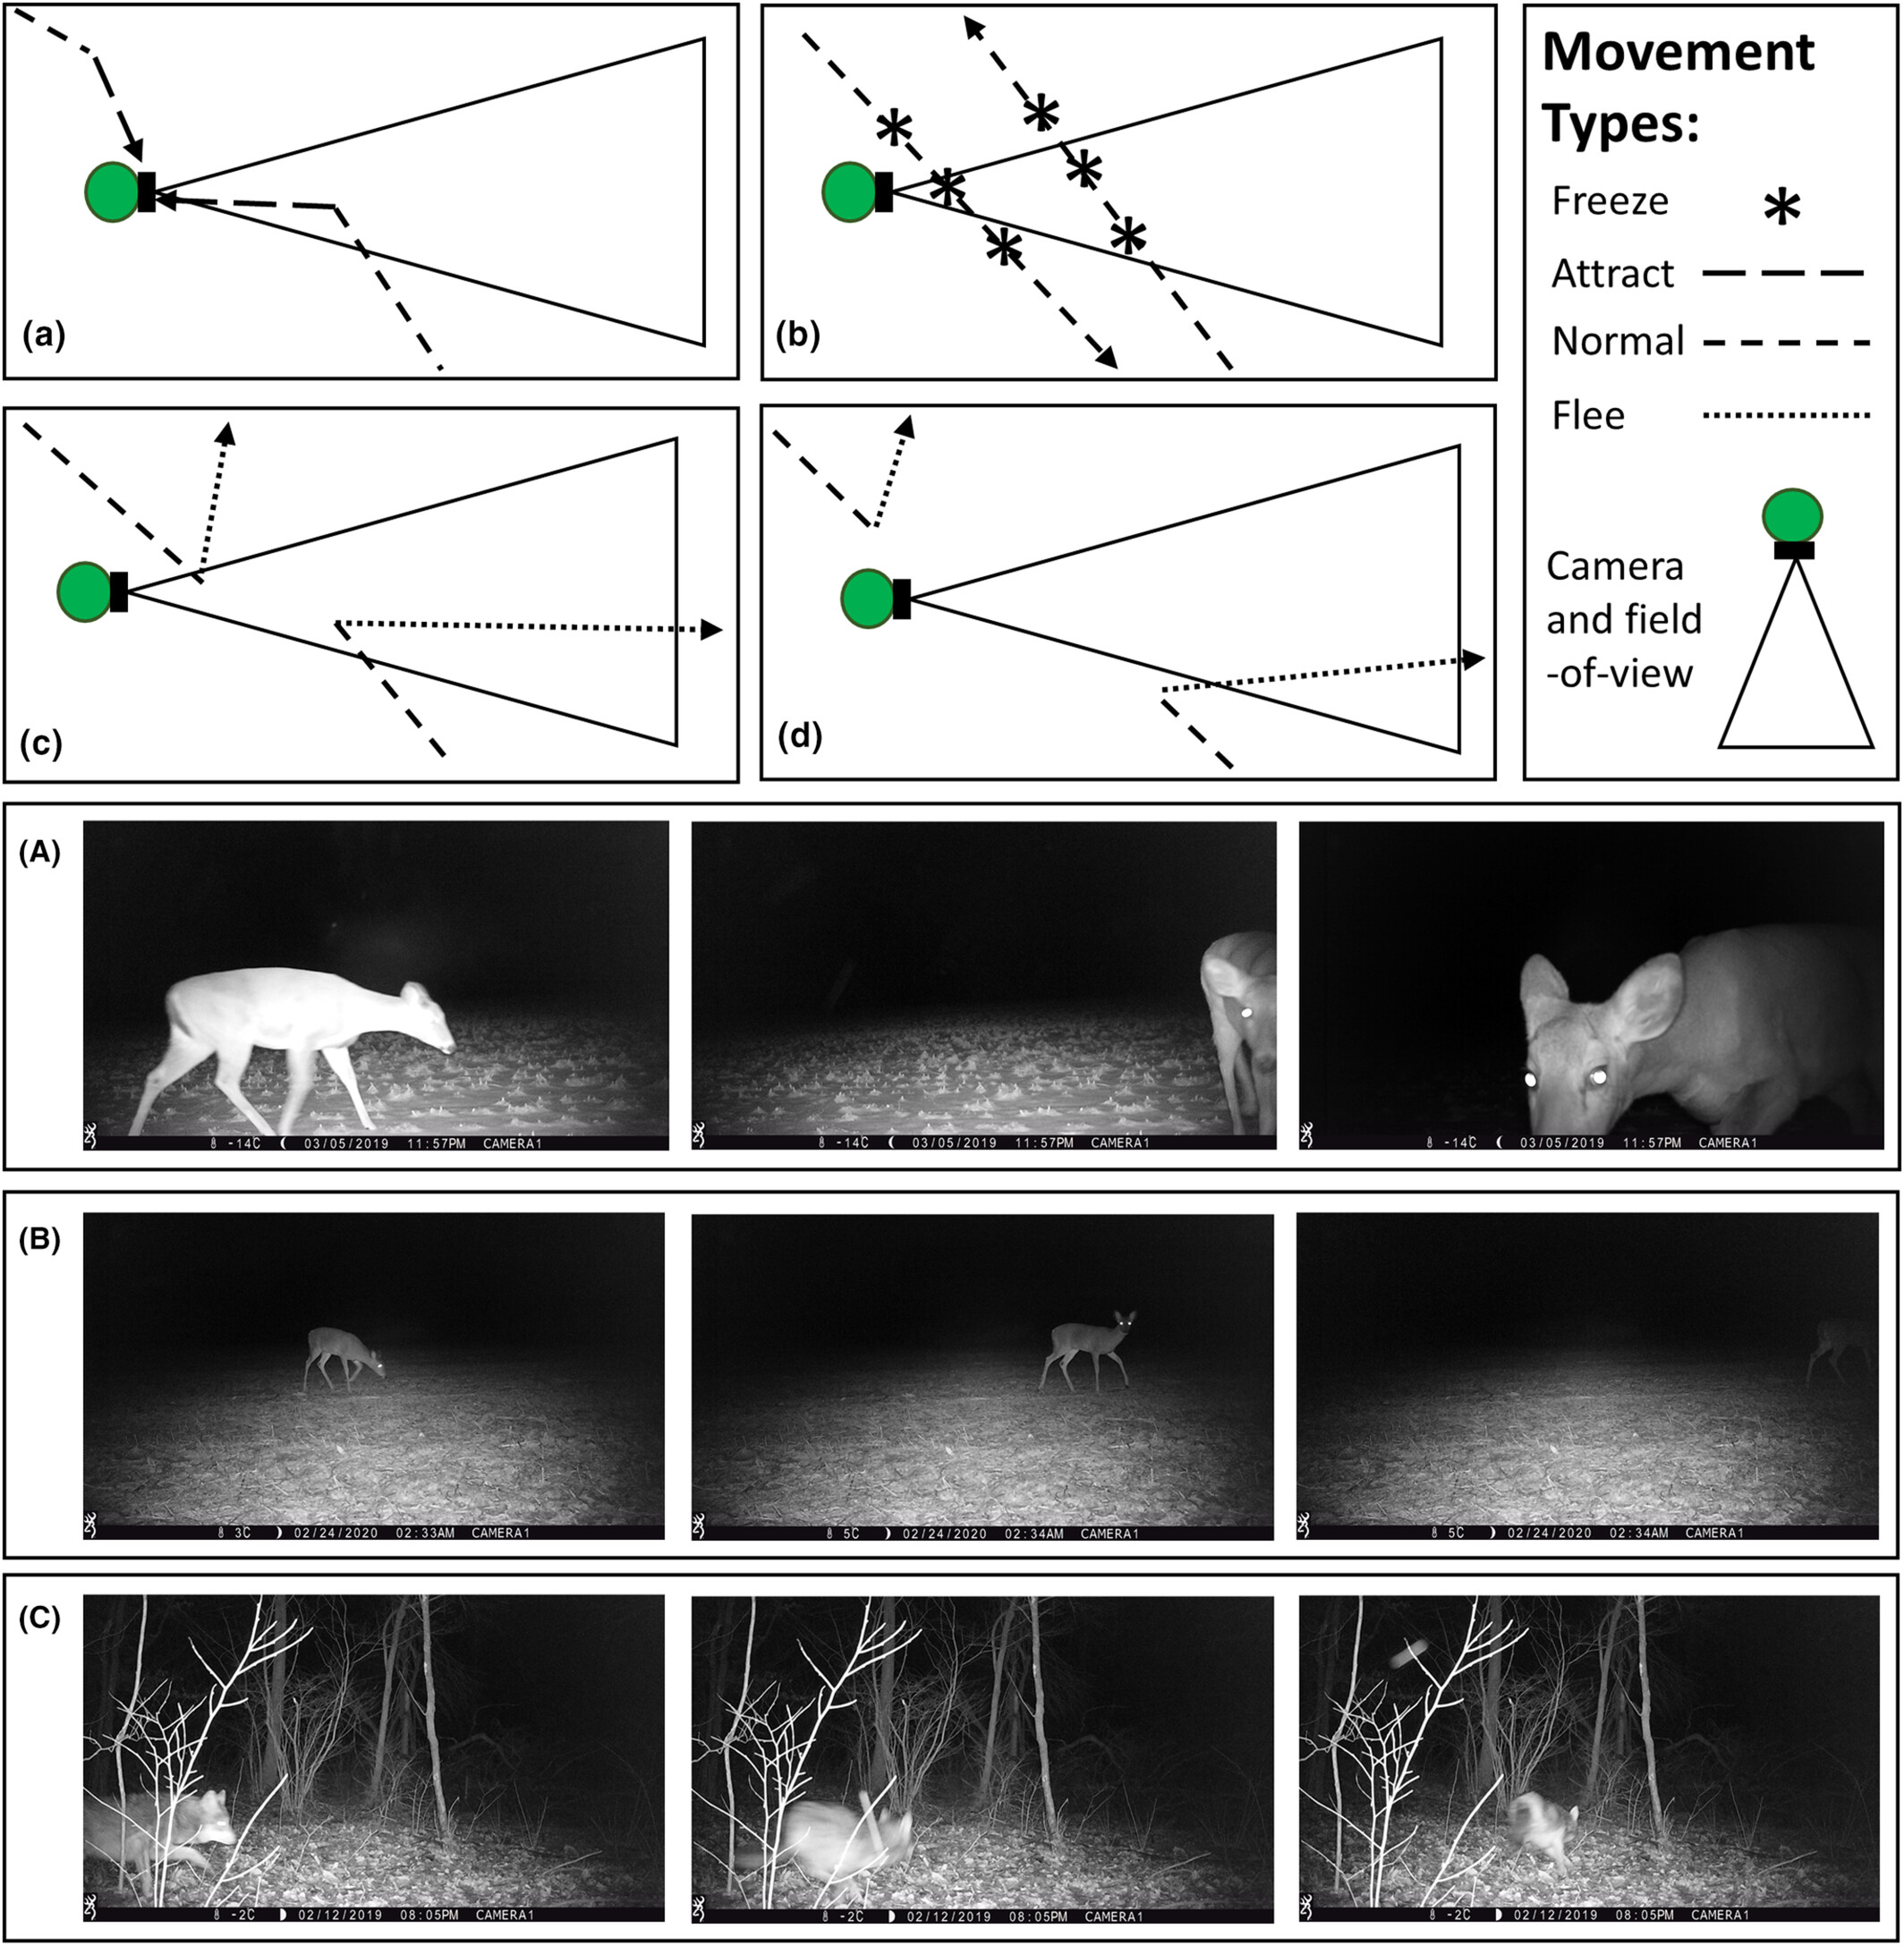
Delisle et al. (2023) - Fig 1 Conceptual movement paths in which animals exhibit a variety of different reactive behaviours towards camera traps: (A) attraction towards the camera trap; (B) freezing normal travel; (C) fleeing in response to being detected by the camera trap; and (d) fleeing in response to the presence of the camera trap regardless of being detected. Panels depicting actual animals exhibiting a variety of reactive behaviours towards camera traps: (A) white-tailed deer (Odocoileus virginianus) that is attracted towards the camera trap; (B) white-tailed deer that freezes in front of a camera trap; and (C) coyote (Canis latrans) that flees in response to being detected by a camera trap.
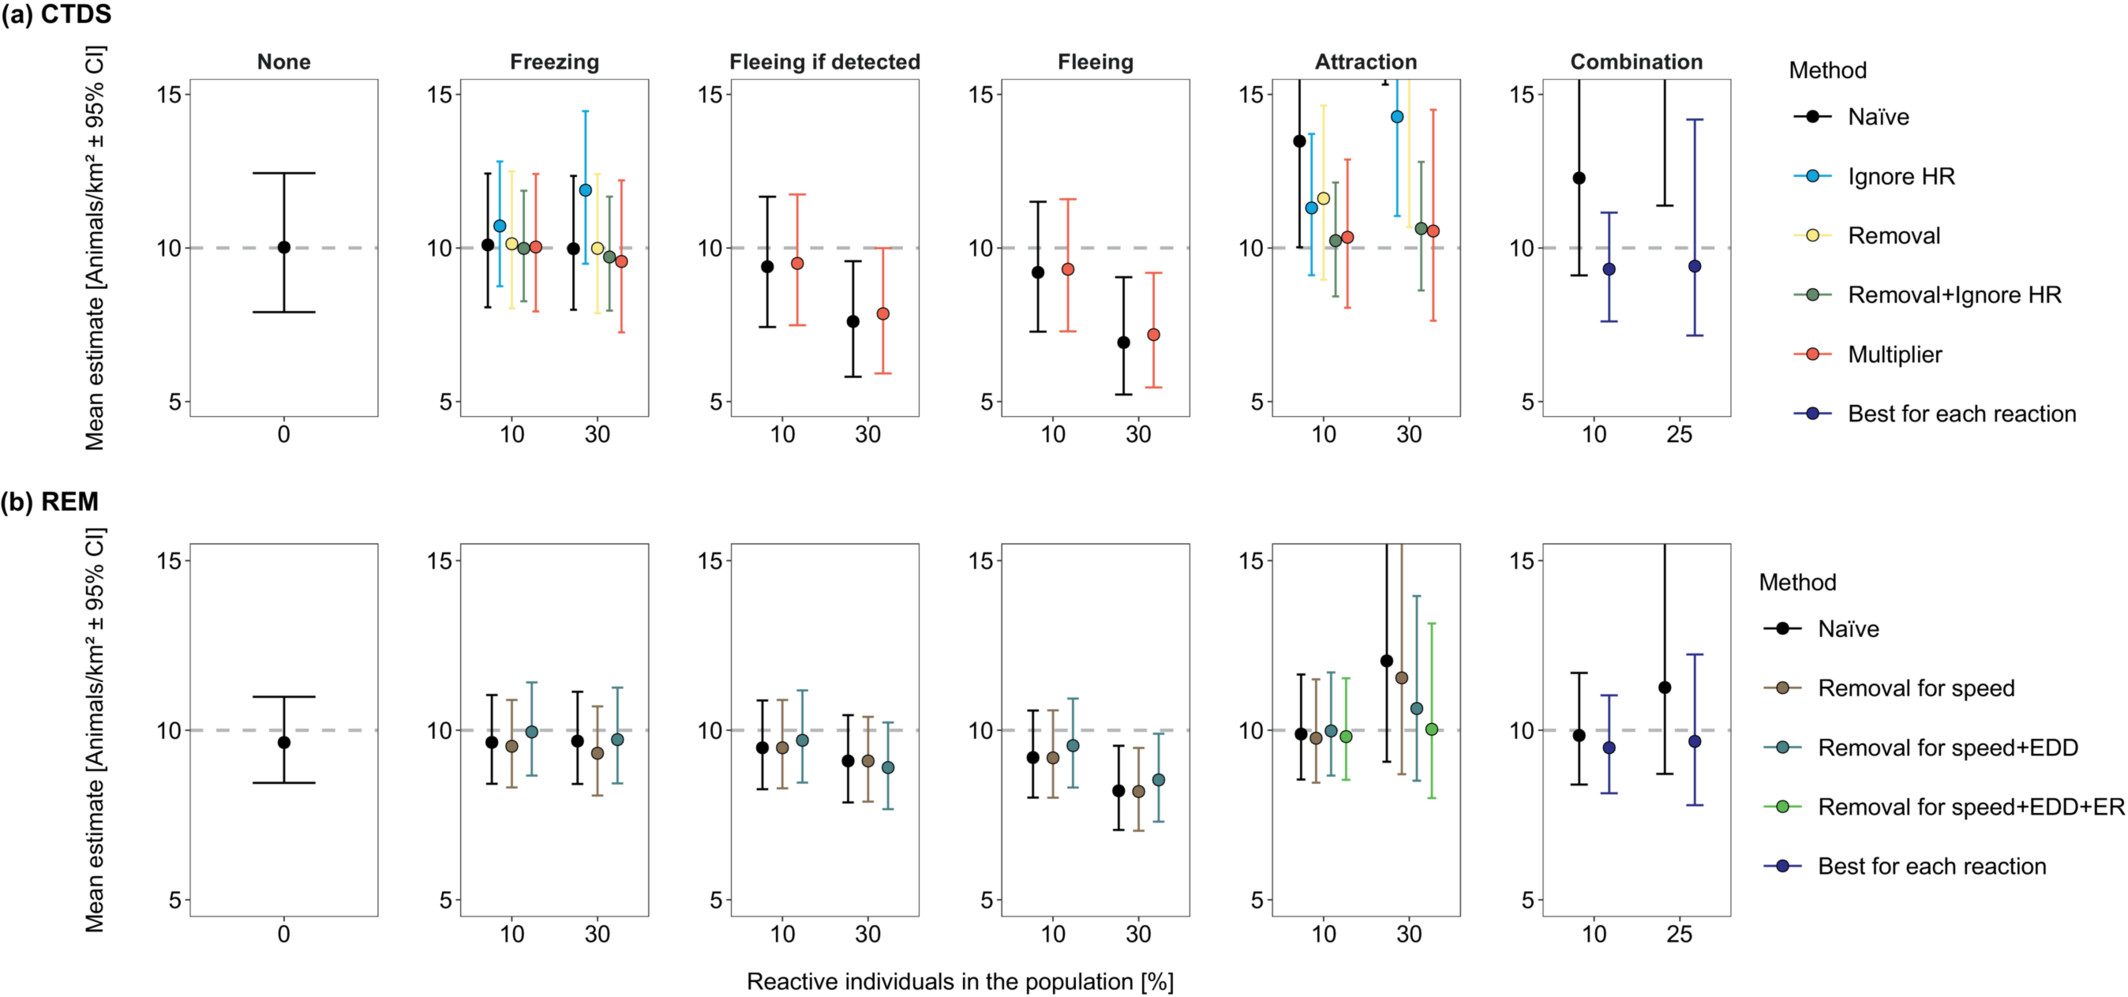
Delisle et al. (2023) - Fig 2 The average density estimates (animals/km2 ± 95% confidence intervals [CI]) from detections of simulated animals at camera traps across 100 total simulations for each reaction type.
Densities were estimated using camera trap distance sampling (CTDS; a) and the random encounter model (REM; b). Simulated populations contained a fraction of the population (reactive individuals in the population [%]) that froze in response to cameras (Freezing), fled from the camera when the camera detected the individual (Fleeing if detected), fled from the camera regardless of being detected by the camera (Fleeing) and were attracted to cameras (Attraction). Additionally, we simulated a population that did not contain any reactive individuals (None). For each density estimate, we enacted a specific method to reduce bias associated with reactive movement (Method). Methods for CTDS included doing nothing (Naïve), removing detections of reactive individuals from consideration (Removal), ignoring the hazard rate key function (Ignore HR), combining Ignore HR and Removal, and using the ratio of average number of detections of reactive and nonreactive individuals as a multiplier (Multiplier). Methods for REM included doing nothing (Naïve), removing reactive encounters when estimating the speed parameter (Removal for speed), removing reactive encounters when estimating the speed parameter and the effective detection distance (Removal for speed +EDD) and removing reactive encounters when estimating the speed parameter, effective detection distance and the encounter rate (Removal for speed +EDD + ER). The grey dotted line represents true density (10 animals/km2). Some density estimates are above the upper limit of the y-axis due to severe bias (see Tables S1 and S2 for these estimates and the extent of their confidence intervals in the Supporting Information).

Diel.Niche Shinyapp
RShiny implementation of Diel.Niche. See Gerber et al. A model-based hypothesis framework to define and estimate the diel niche via the `Diel.Niche’ R package.
Gerber, B. D., Devarajan, K., Farris, Z. J., & Fidino, M. (2023). A model-based hypothesis framework to define and estimate the diel niche via the ‘Diel.Niche’ R package. bioRxiv, 2023.06.21.545898. https://doi.org/10.1101/2023.06.21.545898
Zone of Influence Effect Size and Buffer Distance Calculator
This tool can identify optimal buffer distances for recreational features, such as hiking trails, in natural areas inhabited by grizzly bears and wolves, using the outputs of camera trap modelling work from the Canadian Rockies of Alberta. The models assessed the impact of faraway human use on trails relative to human use at a focal location to estimate the zone of influence of human use on each of these wary species.
Thompson, P. R. (2024) Zone of Influence Effect Size and Buffer Distance Calculator. University of Alberta, Canada. https://pthompson234.shinyapps.io/calculate-zoi/
Type |
Name |
Note |
URL |
Reference |
|---|---|---|---|---|
Paper |
A model-based hypothesis framework to define and estimate the diel niche via the ‘Diel.Niche’ R package |
/- |
Gerber, B. D., Devarajan, K., Farris, Z. J., & Fidino, M. (2023). A model-based hypothesis framework to define and estimate the diel niche via the ‘Diel.Niche’ R package. bioRxiv, 2023.06.21.545898. https://doi.org/10.1101/2023.06.21.545898 |
|
R package |
Diel-Niche-Modeling |
“An R package to evaluate hypotheses of diel phenotypes based on empirical data and estimate the probabilitiy of activity during the crepuscular, daytime, and nighttime periods.” |
Gerber, B. D., Devarajan, K., Farris, Z. J., & Fidino, M. (2023). A model-based hypothesis framework to define and estimate the diel niche via the ‘Diel.Niche’ R package. bioRxiv, 2023.06.21.545898. https://doi.org/10.1101/2023.06.21.545898 |
|
R Shiny |
Diel.Niche Shinyapp |
“RShiny implementation of Diel.Niche. See Gerber et al. A model-based hypothesis framework to define and estimate the diel niche via the `Diel.Niche’ R package.” |
Gerber, B. D., Devarajan, K., Farris, Z. J., & Fidino, M. (2023). A model-based hypothesis framework to define and estimate the diel niche via the ‘Diel.Niche’ R package. bioRxiv, 2023.06.21.545898. https://doi.org/10.1101/2023.06.21.545898 |
|
Tutorial |
An Introduction to Camera Trap Data Management and Analysis in R > Chapter 14 Behavior |
https://bookdown.org/c_w_beirne/wildCo-Data-Analysis/behavior.html |
WildCo Lab (2021e). Chapter 14 Behavior. https://bookdown.org/c_w_beirne/wildCo-Data-Analysis/behavior.html |
|
R Package |
R Package ‘activity’ |
“ Provides functions to express clock time data relative to anchor points (typically solar); fit kernel density functions to animal activity time data; plot activity distributions; quantify overall levels of activity; statistically compare activity metrics through bootstrapping; evaluate variation in linear variables with time (or other circular variables).” |
Rowcliffe, M. (2023). *Package ‘activity. * R package version 1.3.4. https://cran.r-project.org/web/packages/activity/index.html |
|
Article |
A simple statistical guide for the analysis of behaviour when data are constrained due to practical or ethical reasons |
Garamszegi, L. Z. (2016). A simple statistical guide for the analysis of behaviour when data are constrained due to practical or ethical reasons. Animal Behaviour, 120, 223-234. https://doi.org/10.1016/j.anbehav.2015.11.009 |
||
Article / Tutorial / R Code |
A “How-to” Guide for Estimating Animal Diel Activity Using Hierarchical Models |
Companion manuscript, tutorial and R Code; “The tutorial includes step-by-step examples on how to use trigonometric and cyclic cubic spline hierarchical models to analyze activity patterns from time-stamped data. We present case studies based on camera-trap data, but these approaches can be applied to data collected via other static sensors (e.g., acoustic recorders).” (Iannarilli et al., 2024b). |
- Article: https://besjournals.onlinelibrary.wiley.com/doi/10.1111/1365-2656.14213?af=R |
{ rbib_caravaggi_et_al_2017 }} Caravaggi, A., Burton, A. C., Clark, D. A., Fisher, J. T., Grass, A., Green, S., Hobaiter, C., Hofmeester, T. R., Kalan, A. K., Rabaiotti, D., & Rivet, D. (2020). A Review of Factors To Consider When Using Camera Traps To Study Animal Behavior To Inform Wildlife Ecology And Conservation. Conservation Science and Practice, 2(8). https://doi.org/10.1111/csp2.239 Gerber, B. D., Devarajan, K., Farris, Z. J., & Fidino, M. (2023). A model-based hypothesis framework to define and estimate the diel niche via the ‘Diel.Niche’ R package. bioRxiv, 2023.06.21.545898. https://doi.org/10.1101/2023.06.21.545898 Meek, P. D., Ballard, G. A., Fleming, P. J. S., Schaefer, M., Williams, W., & Falzon, G. (2014a). Camera Traps Can Be Heard and Seen by Animals. PLoS One, 9(10), e110832. https://doi.org/10.1371/journal.pone.0110832 WildCo Lab (2021d). Chapter 12 Activity. https://bookdown.org/c_w_beirne/wildCo-Data-Analysis/activity.html