Random encounter and staying time (REST)#
Hint
See also
Assumptions, Pros, Cons
Demographic closure (i.e., no births or deaths) and geographic closure (i.e., no immigration or emigration) (animal density is constant during the survey) (Rowcliffe et al., 2008)
Detection is perfect (detection probability ‘p’ = 1) (Wearn & Glover-Kapfer, 2017) unless otherwise modelled (Nakashima et al., 2017)
Camera locations are representative of the available habitat (Nakashima et al., 2017)
Camera locations are randomly placed relative to the spatial distribution of animals (Nakashima et al., 2017)
Animal movement and behaviour are unaffected by the cameras (Nakashima et al., 2017)
The observed distribution of staying time in the focal area fits the distribution of movement (Nakashima et al., 2017)
The observed staying time must follow a given parametric distribution (Nakashima et al., 2017)
Provides unbiased estimates of animal density, even when animal movement speed varies, and animals travel in pairs (Nakashima et al., 2017)
Attraction or aversion to cameras is exhibited in some species (Meek et al., 2016) and could affect the time within the detection zone and subsequently affect estimates of density (Doran-Myers, 2018)
Requires accurate measurements of the area of the camera’s detection zone, which has been a challenge in previous studies (Rowcliffe et al., 2011; Cusack et al., 2015; Anile & Devillard, 2016; Doran-Myers, 2018; Nakashima et al., 2017)
Mathematically challenging (Cusack et al., 2015)
“The REST model describes the relationship among population density, mean number of detections by a camera trap during a survey period, and staying time of individual animals in a predetermined detection zone in which individuals are certain to be detected by the camera trap.” (Nakashima et al., 2017). ….
This section will be available soon! In the meantime, check out the information in the other tabs!
Note
This content was adapted from: The Density Handbook, “Using Camera Traps to Estimate Medium and Large Mammal Density: Comparison of Methods and Recommendations for Wildlife Managers” (Clarke et al., 2023)
The random encounter and staying time (REST) model is an extension of the random encounter model (REM; (Gilbert et al., 2020). Like the REM, the REST treats animals like ideal gas particles (i.e., like randomly and independently moving entities); unlike the REM, the REST does not require measures of animal movement speed. Instead, the model uses the time animals spend in the camera viewshed (i.e., their “staying time”) as a proxy for animal movement speed, since the two measures are inversely proportional (Nakashima et al., 2017).
The REST equation is a modified version of the REM equation which substitutes staying time for movement speed, and a detection area of set size for detection zone radius and angle, such that:
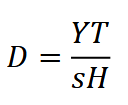
where 𝑌 is the number of detections, 𝑇 is the staying time, 𝑠 is the area within which all individuals are certain to be detected (hereafter, focal area), and 𝐻 is the total research period (i.e., the total sampling time; Nakashima et al., 2017). This equation produces an estimate of density 𝐷 at a single camera; to determine population density for the study area, density estimates must be averaged across camera stations.
To implement the REST model, practitioners must first establish the focal area 𝑠. Methods at practitioners’ disposal include testing focal areas of different sizes under controlled conditions (e.g., using domestic animals) and determining detection probabilities (Nakashima et al., 2017; Rowcliffe et al., 2014), or using distance sampling (DS) functions to delineate the zone of certain detection (as described in Hofmeester et al. [2017] and implemented in Palencia et al. [2021]). Although it can be any shape, a triangular focal area maximizes the number of usable detections (fewer captures fall outside of the focal area; Nakashima et al., 2017).
Once established, the focal area is staked out in front of every camera in the field (e.g., using ropes and pegs), a reference image is taken, and any staking equipment is removed before the camera is left to collect images or videos (Nakashima et al., 2017; Palencia et al., 2021; Nakajima, 2021a). During image processing, captures of animals are overlaid on reference images (Figure 8A; Nakajima, 2021a). Alternatively, the focal area can be superimposed on captures of animals as in Figure 8B. Markers (e.g., stones) placed at known distances from the camera are used as a guide for placing the focal area (Palencia et al., 2021). Staying time 𝑇 is the time an animal spends in the focal area; it is measured from the moment an animal’s hind leg enters the focal area until it exits (i.e.,* 𝑇𝑒𝑥𝑖𝑡 − 𝑇𝑒𝑛𝑡𝑒𝑟*).
Importantly, estimates of density 𝐷 must be corrected for activity level – that is, the proportion of time animals are active – such that:

where 𝐷̂ is the corrected density estimate and 𝑎 is the activity level (Palencia et al., 2021, (Rowcliffe et al., 2014). Activity level is determined as per Rowcliffe et al. (2014).
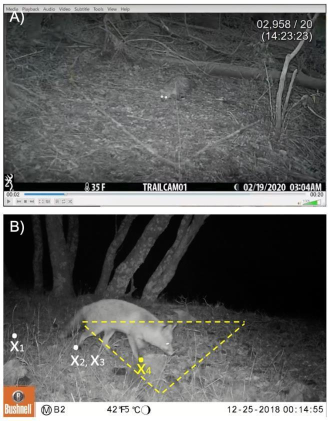
Clarke et al. 2023 - Fig. 8. A) Still from 中島啓裕’s (2021a) video series. Example of overlaying a video recording of an animal on a Reference image of the focal area (faint triangle) to determine staying time 𝑇. B) Still from Appendix S2 from Palencia et al. (2021). Example of superimposing the focal area on an image capture.
Simulations and Field Experiments
Nakashima et al. (2017) ran random walk simulations to test the REST’s performance. In its simplest form, a random walk models the series of steps an animal (the “walker”) takes – each in a completely arbitrary direction, or in a pattern informed by behaviour, ecology and environment (Codling et al., 2008). Nakashima et al.’s (2017) simulations showed that the REST model was robust to grouping behaviour and variation in animal movement speed. More specifically, the REST produced accurate estimates of density when animals travelled in pairs, and when animals covered different distances during the sampling period (Nakashima et al., 2017). The model produced biased results, however, when captures of animals resting in the focal area were included in staying times (Nakashima et al., 2017). To minimize bias: 1) any detections with exceedingly long staying times (i.e., right outliers) should be discarded; and 2) density estimates should be corrected for activity level 𝑎 using the method outlined in Rowcliffe et al. (2014; Nakashima et al., 2017).
Garland et al. (2020) ran a “real life” simulation of the REST using human volunteers. The researchers found that the model produced accurate density estimates, even when home range size, population size and movement patterns varied – but that scenarios in which people moved at a constant rate yielded more precise estimates than those in which people rested periodically (Garland et al., 2020). Larger populations were also associated with lower-precision estimates (i.e., the bigger the population, the less precise the density estimate) – as population size increases, so too does the variation in staying times, reducing the overall precision of REST estimates (Garland et al., 2020). Note than humans were fully agnostic to detectors – an assumption often violated by animals (Caravaggi et al., 2020).
Both Garland et al. (2020) and Nakashima et al. (2018) tested the effect of sampling effort on the REST; both concluded that the model can yield accurate results, even when effort is relatively small (1% of study area sampled or 10 cameras deployed for 10 days, respectively). Note, however, that these results pertain to very high-density populations – animal density was 125 to 750 individuals per km2 in Garland et al. (2020) and 10 individuals per km2 in Nakashima et al. (2018) – and likely do not apply to average-to-low density populations. Low sampling effort was also linked to imprecision – the fewer cameras deployed, the less precise the density estimate (Garland et al., 2020; Nakashima et al., 2017). Thus, although little sampling effort is needed to produce accurate density estimates for very dense populations, considerable sampling effort will be necessary for most populations, and to produce precise estimates.
In the field
The REST was initially validated by Nakashima et al. (2018), who compared density estimates of forest-dwelling antelopes from the camera data-based model and line-transect surveys (see Distance sampling). In this system, both methods produced similar estimates of antelope density, with similar precision (Nakashima et al., 2017). A follow-up study in the same area further demonstrated that the model can produce unbiased estimates of density (Nakashima et al., 2020).
The model produced estimates of snowshoe hare density comparable to livetrapping SCR in the boreal forest of the northwestern United States (Jensen et al., 2022). REST- and REM-based estimates were also consistent with each other, and both models outperformed the time-to-event model (TTE; see Time-to-event); Jensen et al., 2022).
Palencia et al. (2021) found that REST-derived density estimates were consistent with line-transect surveys of deer, but not with drive-count surveys of boar; the REST underestimated density compared to the latter. The model was, however, highly consistent with the REM and camera trap distance sampling (DS; Palencia et al., 2021). Furthermore, the REST was more precise than the other two camera models – although not significantly (Palencia et al., 2021).
Practitioners should be aware that population densities were quite high in the studies listed above (about 1 to 160 animals per km2; Jensen et al., 2022; Nakashima et al., 2017). Thus, while the REST model applies well to very dense populations, it may not be appropriate for average-to-low density populations (e.g., wildlife populations in BC, with densities often <1 animal/km2); further investigation is needed (Morin et al., 2022). The precision of the REST is also inversely related to population size – the smaller the population, the less precise the density estimate (Morin et al., 2022).
Clarke et al. (2023) - Fig. 8 A) Still from 中島啓裕’s (2021) video series. Example of overlaying a video recording of an animal on a Reference image of the focal area (faint triangle) to determine staying time 𝑇. B) Still from Appendix S2 from Palencia et al. (2021). Example of superimposing the focal area on an image capture.
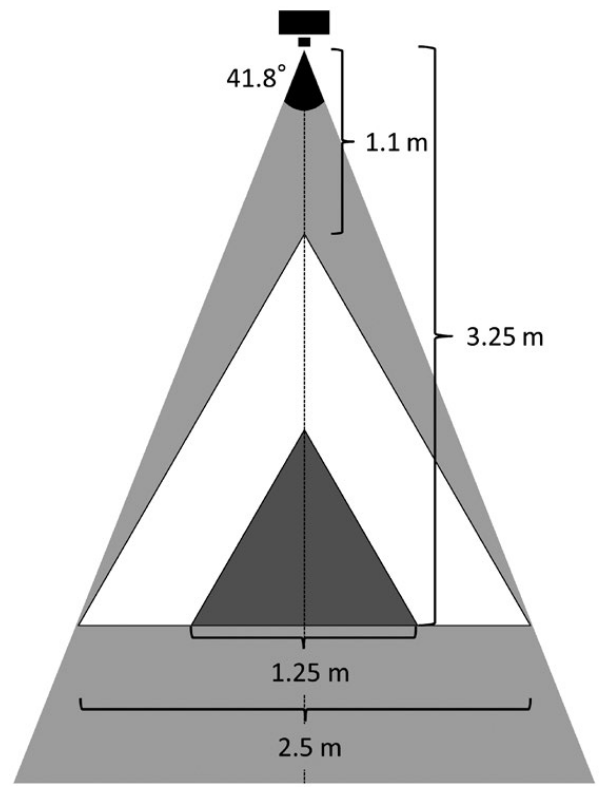
Nakashima et al. (2017) - Fig. 1 The view-angle and total area in which camera traps (Bushnell Trophy Cam 2010) can successfully detect passing animals and capture video images of them (grey triangle). Only video data capturing animals that passed within the larger (white; 2.67 m2) or smaller focal area (black; 0.67 m2) were used for density estimations. See text for the details.

Density Estimation with the REST Model > REST_01_Set_Focal_Area
Density Estimation with the REST Model > REST_02_Set_Up_Emv
Density Estimation with the REST Model > REST_03_MeasureStayingTime
Check back in the future!
Type |
Name |
Note |
URL |
Reference |
|---|---|---|---|---|
Article |
One size does not fit all: A novel approach for determining the Realised Viewshed Size for remote camera traps. |
Carswell, B. M., Avgar, T., Street, G. M., Boyle, S. P., & Vander Wal, E. (2024). One size does not fit all: A novel approach for determining the Realised Viewshed Size for remote camera traps. Ecology. https://doi.org/10.1101/2024.05.09.593241 |
||