Species-accumulation curves / asymptote#
Hint
The species-accumulation asymptote refers to the point at which the number of new species discovered in a particular area stops increasing significantly as more samples are taken. In simpler terms, it’s when you’ve collected enough data (or sampled long enough) and you start seeing the same species over and over, rather than discovering new ones. At this point, you’ve essentially identified most of the species that live there, and further sampling will likely only confirm the species already known, rather than revealing new ones.
Refer to the info-box below for an explanation of the more technical jargon, as well as a visualization of how this works. Note: this question is only applicable to the objective “species richness & diversity.”
If you’re not sure, select the conservative answer of “Yes”
See also
Species-accumulation asymptote: the point on a species accumulation curve (a graph showing the relationship between the cumulative number of species detected as survey effort increases) where you’ve sampled long enough to observe most of the species present.
To understand what we mean when we say, “species-accumulation asymptote”, we must first explain species accumulation curves. A species accumulation curve shows you the relationship between the cumulative number of species detected vs. sampling effort (Deng et al., 2015) (e.g., how you might expect to “accumulate” detections of new species as cameras are deployed for longer). Species accumulation curves are useful to compare diversity across populations, or to evaluate the benefits of additional sampling (Van Dooren, 2016). The term “asymptote” in this context refers to the idea of a curve or pattern that gradually gets closer and closer to a certain value but never quite reaches it. In the case of species accumulation, the “asymptote” is the point where the number of new species you discover starts to level off and becomes very smal. Thus, the species-accumulation asymptote refers to the point on the curve where you’ve sampled long enough to observe most of the species present.
Consider the following figure:
- padding:
1
- margin:
2
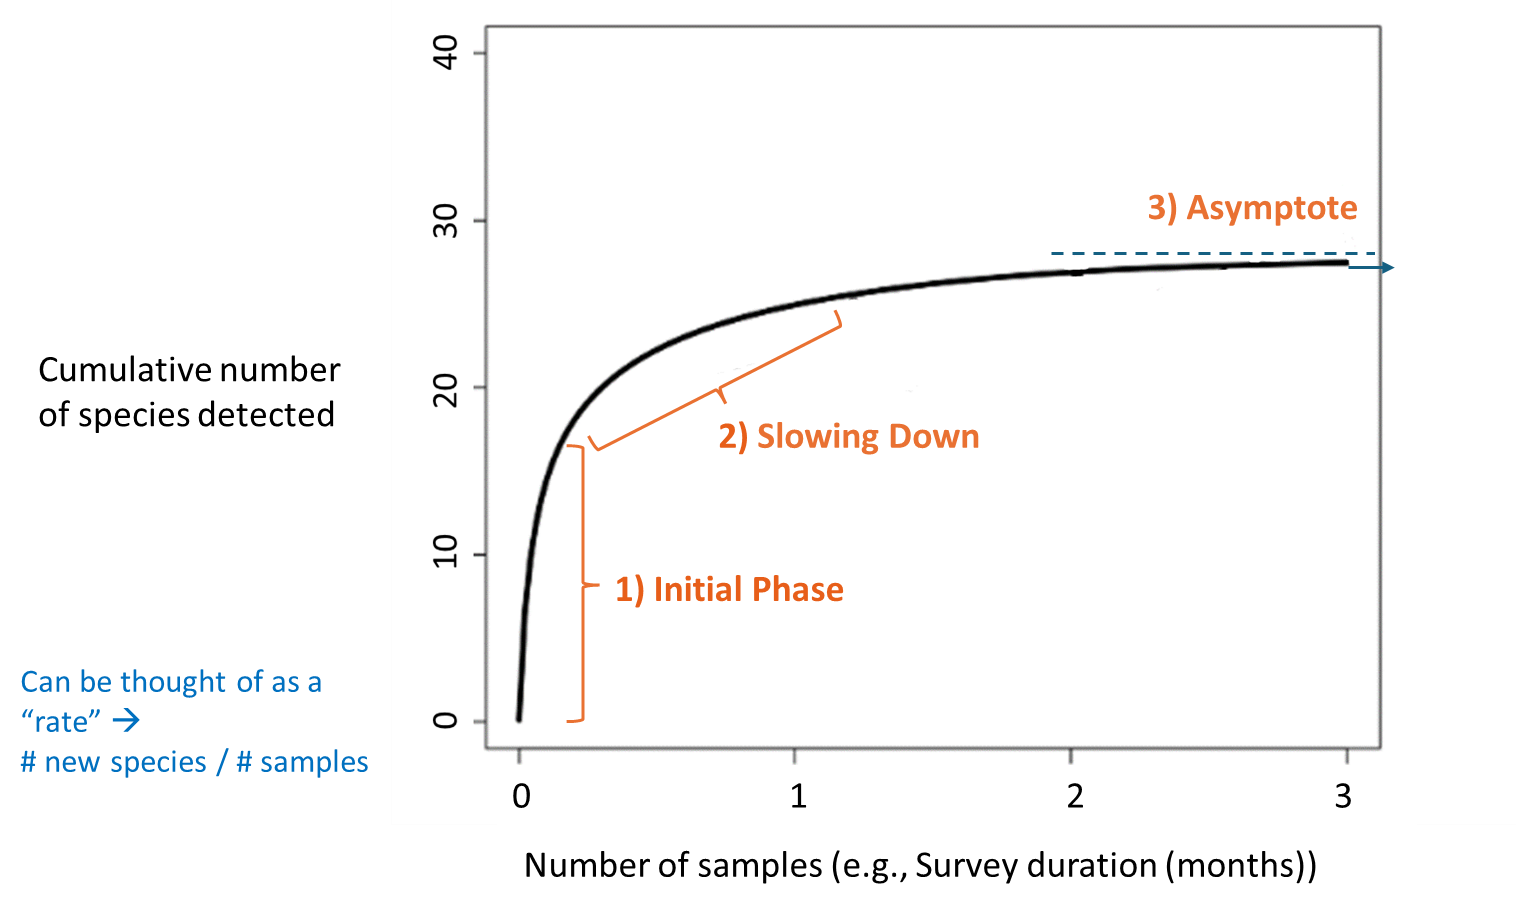
On a graph, the species-accumulation curve typically shows the number of species discovered (vertical/y-axis) as a function of the amount of sampling effort or time (horizonal/x-axis).
Initial Phase: At the beginning of the graph, the curve rises steeply, meaning that with each additional sample (or block of time), you discover many new species.
Slowing Down: As you sample more and more, you continue to find new species (the curve is still increasing), however, the rate of discovery slows down over time, and the curve becomes less steep.
Asymptote: Eventually, the curve flattens out, forming a horizontal line. The flatness of this line shows that the rate of discovering new species is minimal; this is what is referred to as the ‘asymptote.’ This indicates that no matter how much more you sample, you’re unlikely to find many new species, and thus you’ve nearly identified all the species present in that area.
This section will be available soon! In the meantime, check out the information in the other tabs!

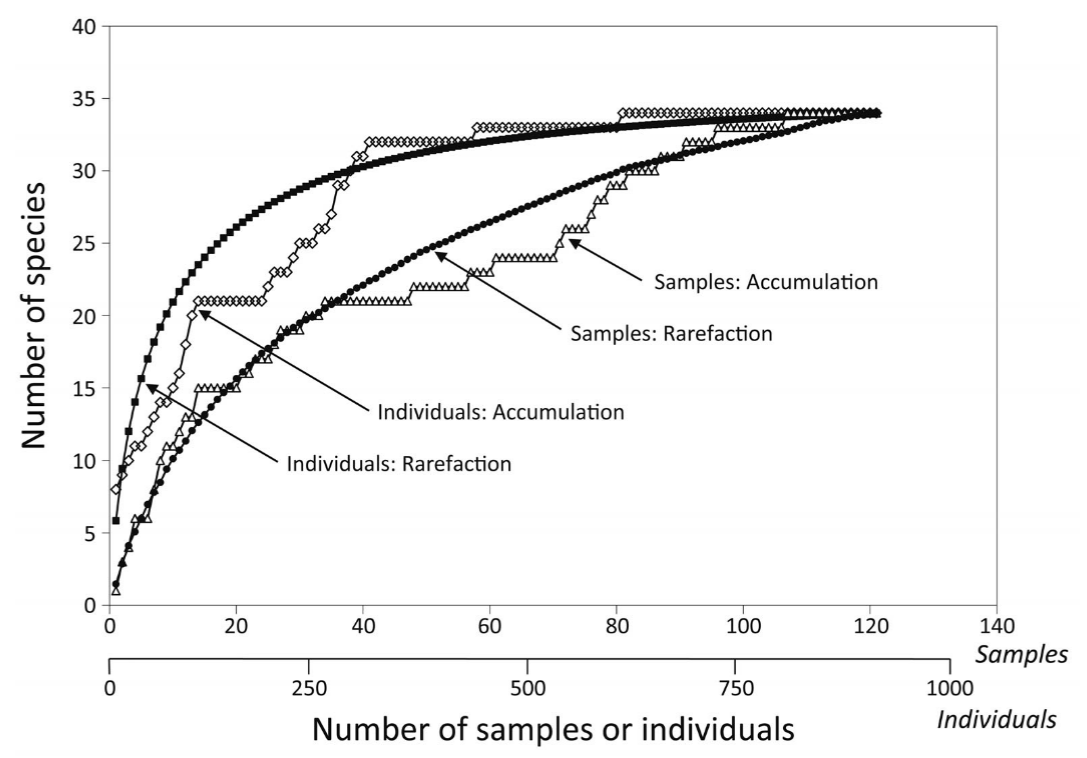
Gotelli & Colwell (2011) - Fig. 4.1 Species accumulation and rarefaction curves.
The jagged line is the species accumulation curve for one of many possible orderings of 121 soil seedbank samples, yielding a total of 952 individual tree seedlings, from an intensive census of a plot of Costa Rican rainforest (Butler & Chazdon 1998). The cumulative number of tree species (y-axis) is plotted as a function of the cumulative number of samples (upper x-axis), pooled in random order. The smooth, solid line is the sample-based rarefaction curve for the same data set, showing the mean number of species for all possible combinations of 1, 2, … , m∗, … , 121 actual samples from the dataset—this curve plots the statistical expectation of the (sample-based) species accumulation curve. The dashed line is the individual-based rarefaction curve for the same data set—the expected number of species for (m∗) (952/121) individuals, randomly chosen from all 952 individuals (lower x-axis). The black dot indicates the total richness for all samples (or all individuals) pooled. The sample-based rarefaction curve lies below the individual-based rarefaction curve because of spatial aggregation within species. This is a very typical pattern for empirical comparisons of sample-based and individual-based rarefaction curves.
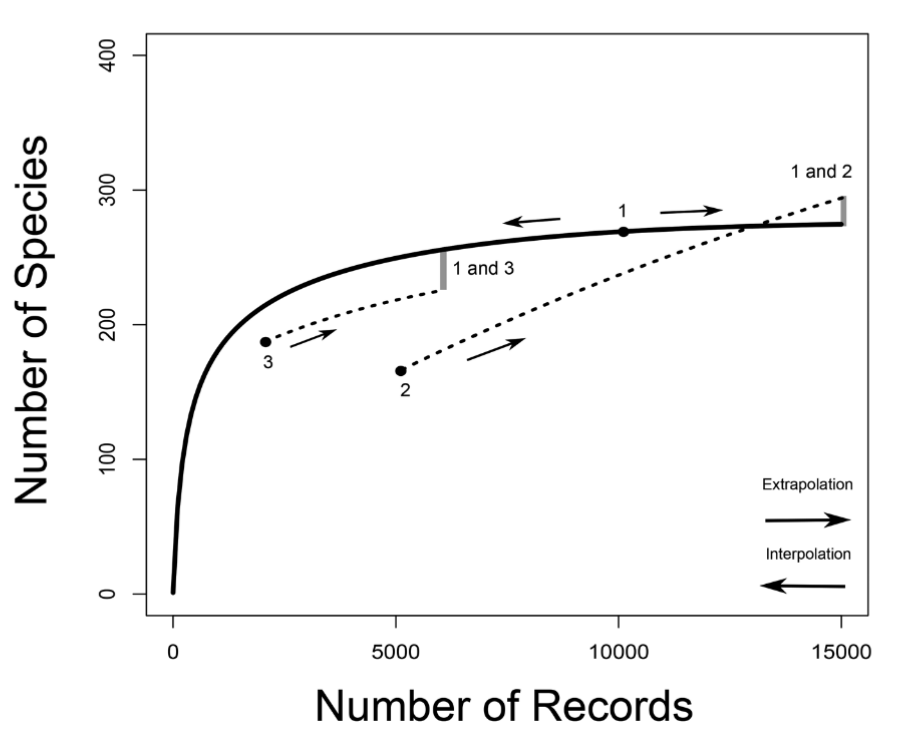
Van Dooren (2015) - Fig. 1 “Species accumulation curves. Species richness is the asymptote of a species accumulation curve, which expresses the dependence on sampling effort of the number of species sampled from an assemblage.
In CA2013, sampling effort is given by the number of records from which the number of species is calculated. For illustrative purposes, an example with three arbitrary samples (for 10000, 5000 and 2000 records, labeled from one to three) is drawn. For sample one, a predicted species accumulation curve is added that gradually increases from one species sampled to the predicted species richness for that assemblage (full line). Such curves are constructed on the basis of interpolation and extrapolation. For samples two and three only segments of extrapolated curves are drawn (dotted lines). For sample two, a curve that crosses the species accumulation curve of sample one is sketched. For samples one and three species accumulation curves are more or less proportional. The way in which the species richness differences between samples are assessed in CA2013 is illustrated by indicating on the species accumulation curves at which numbers of records pairwise comparisons would be made between two sample pairs (1 vs. 2 and 1 vs. 3). The number of species of the sample with the smallest number of records is extrapolated to the number expected at three times the number of records. When the number of records of the other sample is still larger than that, the number of species of the second sample is interpolated (rarefied), otherwise it is extrapolated as well.
Loreau (2010) - Fig. 4 Species accumulation and rarefaction curves. Species accumulation curves show the number of species obtained by successively censusing either individual organisms (individual-based accumulation curves) or samples (sample-based accumulation curves). Smoothed species rarefaction curves represent the statistical expectation of the corresponding accumulation curves. Credit: Rob Colwell, after Gotelli and Colwell (2001)
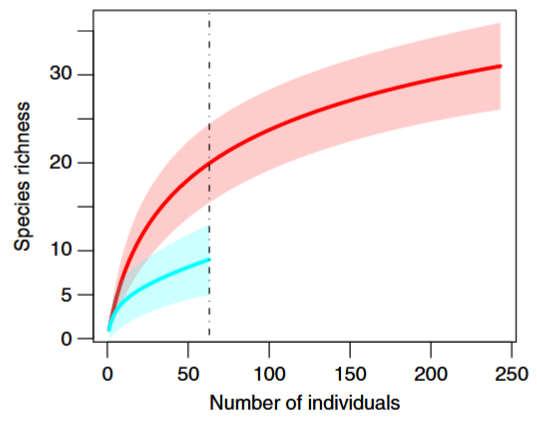
Gotelli & Chao (2013) - Fig. 4 Standardized comparison of species richness for two individual-based rarefaction curves.
The data represent summary counts of carabid beetles that were pitfall-trapped from a set of young pine plantations (o20 years old; upper curve) and a set of old pine plantations (20–60 years old; lower curve). The solid lines are the rarefaction curves, calculated from eqn [2], and the shaded polygons are the 95% confidence intervals, calculated from the unconditional variance eqn [5]. The young plantation samples contained 243 individuals representing 31 species, and the old plantation samples contained 63 individuals representing nine species. The dashed and dotted vertical line illustrates a species richness comparison standardized to 63 individuals, which was the observed abundance in the smaller of the two data sets. Data from Niemel ̈a J, Haila Y, Halme E, et al. (1988) The distribution of carabid beetles in fragments of old coniferous taiga and adjacent managed forest. Annales Zoologici Fennici 25: 107–199.
Molloy (2018) - Fig. 9 Species accumulation curve for camera trap data collected in Dryandra Woodland. Sourced from Thomas & Cowan (2016)
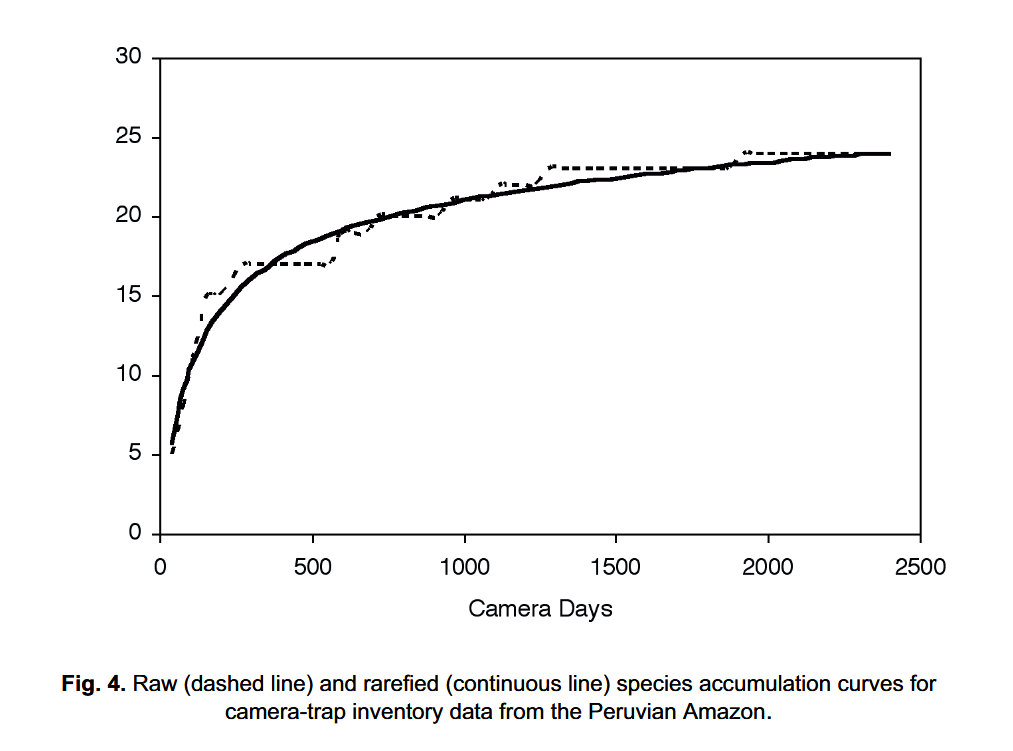
Rovero & Tobler (2010) - Fig. 4 Raw (dashed line) and rarefied (continuous line) species accumulation curves for camera-trap inventory data from the Peruvian Amazon.
Species Accumulation Curves (11 minutes)
Generating a species accumulation plot in excel for BBS data
Video to accompany the “iNext Online” R Shiny App
Rarefied Species Accumulation Curves (the simple way) tutorial: How to create beautiful rarefied species accumulation curves with species richness, shannon wiener or the simpson index with abundance data, or species richness with incidence data using the iNext Online interface (which runs the iNext R package in the backgroundl
Software for interpolation and extrapolation of species diversity
Type |
Name |
Note |
URL |
Reference |
|---|---|---|---|---|
R package / Tutorial |
Species Accumulation Curve Tutorial |
https://www.pisces-conservation.com/sdrhelp/index.html?specaccum.html |
Chao, A., Ma, K. H., & Hsieh, T. C. (2016). iNEXT Online: Software for Interpolation and Extrapolation of Species Diversity. Program and User’s Guide published at http://chao.stat.nthu.edu.tw/wordpress/software_download/inextonline/ |
|
R package / Tutorial |
Species Accumulation Curves with vegan, BiodiversityR and ggplot2 |
Roeland Kindt, R. (2020). Species Accumulation Curves with vegan, BiodiversityR and ggplot2. https://rpubs.com/Roeland-KINDT/694021 |
||
R Shiny App |
iNext Online |
Chao, A., Ma, K. H., & Hsieh, T. C. (2016). iNEXT Online: Software for Interpolation and Extrapolation of Species Diversity. Program and User’s Guide published at http://chao.stat.nthu.edu.tw/wordpress/software_download/inextonline/ |
||
R package |
Package ‘iNEXT’ - Interpolation and Extrapolation for Species Diversity |
Chao, A., Ma, K. H., & Hsieh, T. C. (2016). iNEXT Online: Software for Interpolation and Extrapolation of Species Diversity. Program and User’s Guide published at http://chao.stat.nthu.edu.tw/wordpress/software_download/inextonline/ |
Ahumada, J. A., Silva, C. E. F., Gajapersad, K., Hallam, C., Hurtado, J., Martin, E., McWilliam, A., Mugerwa, B., O’Brien, T., Rovero, F., Sheil, D., Spironello, W. R., Winarni, N., & Andelman, S. J. (2011). Community Structure and Diversity of Tropical Forest Mammals: Data from a Global Camera Trap Network. Philosophical Transactions: Biological Sciences, 366(1578), 2703-2711. https://doi.org/10.1098/rstb.2011.0115
Chao, A., Ma, K. H., & Hsieh, T. C. (2016). iNEXT Online: Software for Interpolation and Extrapolation of Species Diversity. Program and User’s Guide published at http://chao.stat.nthu.edu.tw/wordpress/software_download/inextonline/
Colwell, R., Chao, A., Gotelli, N., Lin, S., Mao, C., Chazdon, R., & Longino, J. (2012). Models and estimators linking individual-based and sample-based rarefaction, extrapolation and comparison of assemblages. Journal of Plant Ecology, 5(1), 3-21. https://doi.org/10.1093/jpe/rtr044
Deng, C., Daley, T., & Smith, A. (2015). Applications of species accumulation curves in large‐scale biological data analysis. Quantitative Biology, 3(3), 135-144. https://doi.org/10.1007/s40484-015-0049-7
Gotelli, N., & Colwell, R. (2001). Quantifying biodiversity: procedures and pitfalls in the measurement and comparison of species richness. Ecology Letters, 4, 379-391. https://doi.org/10.1046/j.1461-0248.2001.00230.x
Gotelli, N., & Colwell, R. (2011). Estimating species richness. In Biological Diversity: Frontiers in Measurement and Assessment (eds. Magurran, A., & McGill, B.). Oxford University Press. Oxford, pp. 39-54. https://www.researchgate.net/publication/236734446_Estimating_species_richness
Gotelli, N. J., & Chao, A. (2013). Measuring and Estimating Species Richness, Species Diversity, and Biotic Similarity from Sampling Data. In Encyclopedia of Biodiversity (pp. 195-211). Elsevier. https://doi.org/10.1016/B978-0-12-384719-5.00424-X
Li, S., McShea, W. J., Wang, D. J., Huang, J. Z., & Shao, L. K. (2012). A Direct Comparison of Camera-Trapping and Sign Transects for Monitoring Wildlife in the Wanglang National Nature Reserve, China. Wildlife Society Bulletin, 36(3), 538-545. https://doi.org/10.1002/wsb.161
Loreau, M. (2010). Estimating Species Richness Using Species Accumulation and Rarefaction Curves. In O. Kinne (Ed.), The Challenges of Biodiversity Science (17th ed., Vol. 1, pp. 20-21). International Ecology Institute. https://www.researchgate.net/publication/285953769_The_challenges_of_biodiversity_science
Molloy, S. W. (2018). A Practical Guide to Using Camera Traps for Wildlife Monitoring in Natural Resource Management Projects. https://doi.org/10.13140/RG.2.2.28025.57449
Roeland Kindt, R. (2020). Species Accumulation Curves with vegan, BiodiversityR and ggplot2. https://rpubs.com/Roeland-KINDT/694021
Rob K Statistics (2018, Oct 16). Species Accumulation Curves [Video]. YouTube. https://www.youtube.com/watch?v=Jj7LYrU_6RA&t=3s
Si, X., Kays, R., & Ding, P. (2014). How long is enough to detect terrestrial animals? Estimating the minimum trapping effort on camera traps. PeerJ, 2, e374. https://doi.org/10.7717/peerj.374
Styring, A. (2020b, Jun 22). Generating a species accumulation plot in excel for BBS data. [Video]. YouTube. https://www.youtube.com/watch?reload=9&app=desktop&v=OEWdPm3zg9I
Van Dooren, T. J. M. (2016). Pollinator species richness: Are the declines slowing down? Nature Conservation, 15, 11-22. https://doi.org/10.3897/natureconservation.15.9616
Wearn, O. R., & Glover-Kapfer, P. (2017). Camera-Trapping for Conservation: A Guide to Best-ractices. WWF conservation technology series, 1, 1-181. http://dx.doi.org/10.13140/RG.2.2.23409.17767
Wearn, O. R., Carbone, C., Rowcliffe, J. M., Bernard, H. & Ewers, R. M. (2016). Grain-dependent responses of mammalian diversity to land-use and the implications for conservation set-aside. Ecological Applications, 26(5), 1409-1420. https://doi.org/10.1890/15-1363
The Wildlife Degree (2022, Feb 3). Rarefied Species Accumulation Curves (the simple way) tutorial. [Video]. YouTube. https://www.youtube.com/watch?v=h3MLWK9IJ4A