Species diversity & richness#
Assumptions, Pros, Cons
Species richness (Alpha diversity)
Camera locations are randomly placed(Wearn & Glover-Kapfer, 2017)
Camera locations are independent (Wearn & Glover-Kapfer, 2017)
Detection probability of different species remains the same (Wearn & Glover-Kapfer, 2017) (‘true’ species richness estimation involves attempting to correct for ‘imperfect detection’ (Wearn & Glover-Kapfer, 2017)
Sampling effort is comparable between camera locations (Royle & Nichols, 2003)
Fundamental to ecological theory and often a key metric used in management (Wearn & Glover-Kapfer, 2017)
Simple to analyze, interpret and communicate (Wearn & Glover-Kapfer, 2017)
Models exist to estimate asymptotic species richness, including unseen species (simple versions of these models - ‘EstimateS’ and the ‘vegan’ R-packages) (Wearn & Glover-Kapfer, 2017)
Dependent on the scale (as captured in the species-area relationship) (Wearn & Glover-Kapfer, 2017)
All species have equal weight in calculations, and community evenness is disregarded (Wearn & Glover-Kapfer, 2017)
Insensitive to changes in abundance, community structure and community composition (Wearn & Glover-Kapfer, 2017)
Species diversity (Beta diversity)
Camera locations are randomly placed(Wearn & Glover-Kapfer, 2017)
Randomness and independence (Wearn & Glover-Kapfer, 2017)
Samples are assumed to have been taken at random from the broader population of sites (Wearn & Glover-Kapfer, 2017)
Can be used to track changes in community composition (Wearn & Glover-Kapfer, 2017)
Plays a critical role in effective conservation prioritization (e.g., designing reserve networks) (Wearn & Glover-Kapfer, 2017)
Important for detecting changes in the fundamental processes (Wearn & Glover-Kapfer, 2017)
No single best measure for all purposes (Wearn & Glover-Kapfer, 2017)
Interpretation/communication not always straightforward (Wearn & Glover-Kapfer, 2017)
Scale-dependent (i.e., influenced by the size of the communities that are being included) (Wearn & Glover-Kapfer, 2017)
Species diversity (Gamma diversity)
Camera locations are randomly placed(Wearn & Glover-Kapfer, 2017)
Camera locations are independent (Wearn & Glover-Kapfer, 2017)
Detection probability of different species remains the same (Wearn & Glover-Kapfer, 2017)
Captures evenness and richness (although some indices only reflect evenness) (Wearn & Glover-Kapfer, 2017)
Most indices are easy to calculate and widely implemented in software packages (e.g., ‘EstimateS’ and ‘vegan’ in R) (Wearn & Glover-Kapfer, 2017)
Many indices exist, and it can be difficult to choose the most appropriate (Wearn & Glover-Kapfer, 2017)
Comparing measures across space, time and studies can be very difficult (Wearn & Glover-Kapfer, 2017)
Insensitive to changes in community composition (Wearn & Glover-Kapfer, 2017) (however, this may be conditional on study design)
Species richness: The total number of species in an assemblage or a sample’ (Gotelli & Chao, 2013).
Species diversity: A measure of diversity that incorporates both the number of species in an assemblage and some measure of their relative abundances.’ (Gotelli & Chao, 2013)
Note that there are multiple parameters corresponding to different scales and incorporating of evenness; these include:
Alpha richness (α): The number of species at the level of an individual camera location (Wearn & Glover-Kapfer, 2017).
Beta-diversity (β): The differences between the communities or, more formally, the variance among the communities (Wearn & Glover-Kapfer, 2017).
Gamma richness (γ): The number of species across a whole study area (Wearn & Glover-Kapfer, 2017).
Refer to the “Assumptions, Pros, Cons” dropdown above to see relevant information for all three.
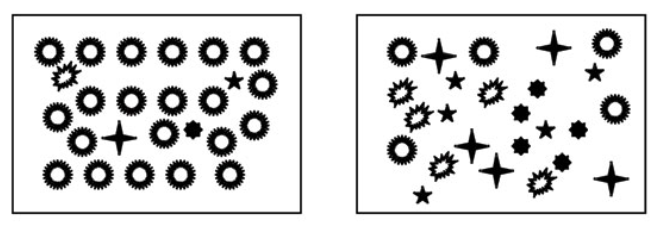
Pyron (2010) - Fig. 1: Species evenness and species richness for animalcule communities. Both communities contain five species of animalcules. Species richness is the same. The community on the left is dominated by one of the species. The community on the right has equal proportions of each species. Evenness is higher when species are present in similar proportions. Thus the community on the left has higher species diversity, because evenness is higher.
Note
This section is still in progress
Species richness: The total number of species in an assemblage or a sample’ (Gotelli & Chao, 2013).
Species diversity: A measure of diversity that incorporates both the number of species in an assemblage and some measure of their relative abundances.’ (Gotelli & Chao, 2013)
Study design
Number of cameras
The optimal number of cameras required will be influenced by factors such as landscape heterogeneity, survey duration and spatial scale, species rarity and desired level of precision (Colyn et al., 2018; Rovero et al., 2013). For example, Kays et al. (2020) found that 25–35 cameras were needed for precise estimates of species richness, depending on the spatial scale of the survey and landscape diversity. In general, deploying more cameras and/or for longer durations always results in more precise estimates; however, users can consider rotating cameras across multiple sites for shorter durations (if feasible).
Duration - Camera days per camera location
For measures of species richness or diversity, it is presumed that a camera is active long enough to detect rare species that may occur at a specific location (Wearn & Glover-Kapfer, 2017). If this is not the case, the results will indicate that the species was not present when it was (i.e., a “false negative”). False negatives may also be problematic for other measures, such as (count data, with or without zero-inflation and/or overdispersion), even if the model type used can account for imperfect detection explicitly (e.g., combined occurrence/; ).
Number of cameras vs. Camera days per camera location
If a user must choose between more cameras vs. fewer cameras with longer surveys, Chatterjee et al. (2021) suggested that for rare species, the optimal precision can be obtained by increasing the number of sites, whereas for common species, increasing the number of samples is more effective. For measuring species richness, Si et al. (2014) found that rotating cameras to new sites was more efficient than leaving cameras at fewer sites for longer periods. O’Connor et al. (2017) also recommended utilizing more cameras vs. increasing study length to increase detection probabilities. In general, regardless of species and objective, increasing the number of survey locations or the survey length improved precision (Chatterjee et al., 2021). Analysis
Note that there are multiple parameters corresponding to different scales and incorporating of evenness; these include:
Alpha richness (α): The number of species at the level of an individual camera location (Wearn & Glover-Kapfer, 2017).
Beta-diversity (β): The differences between the communities or, more formally, the variance among the communities (Wearn & Glover-Kapfer, 2017).
Gamma richness (γ): The number of species across a whole study area (Wearn & Glover-Kapfer, 2017).
Its important to note the difference in Observed vs estimated species richness (from Wearn & Glover-Kapfer, 2017):
Observed species richness: the sum of the number of species seen (e.g. Kitamura et al., 2010; Pettorelli et al., 2010; Ahumada et al., 2011; Samejima et al., 2012)
Observed species richness will not, in general, be a reliable index of actual species richness because, even if sampling effort is strictly controlled, the detectability of species will vary across samples
Estimated species richness: when the “sum of the number of species seen” is adjusted based on corrections for “imperfect detection” (i.e. the fact that some species in a given sample may have been missed)
(e.g. Tobler et al., 2008; Kinnaird & O’Brien, 2012; Brodie et al., 2015; Yue et al., 2015; Wearn et al., 2016)
The two principal ways of estimating species richness from remote camera data are (from Wearn & Glover-Kapfer, 2017):
non-parametric estimators (Gotelli & Chao, 2013), which use information about the rarest species in the sample to provide a minimum estimate of the number of true species (e.g. Tobler et al., 2008),
or 2) occupancy models (MacKenzie et al., 2006)
Pyron (2010) - Fig. 1 Species evenness and species richness for animalcule communities
Both communities contain five species of animalcules. Species richness is the same. The community on the left is dominated by one of the species. The community on the right has equal proportions of each species. Evenness is higher when species are present in similar proportions. Thus the community on the left has higher species diversity, because evenness is higher.
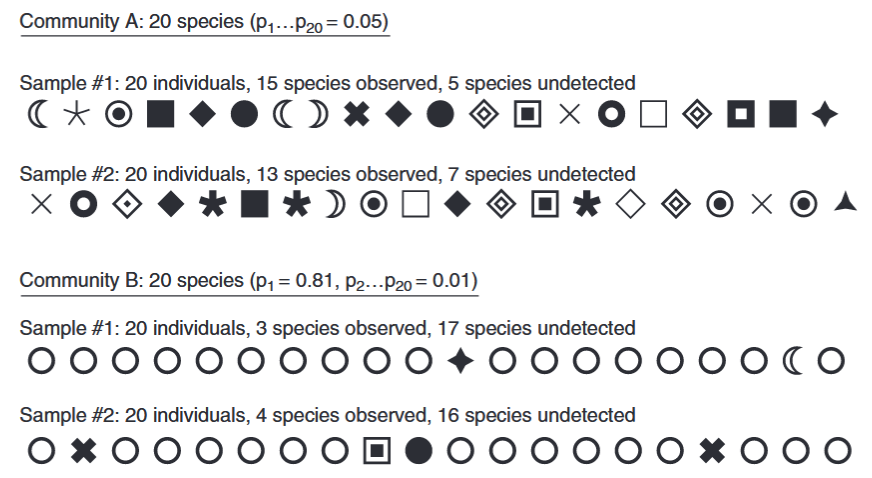
Gotelli & Chao (2013) - Fig. 1 Species richness sampling in a hypothetical walk through the woods. Each different symbol represents one of 20 distinct species, and each row contains 20 characters, representing the first 20 individual trees that might be encountered in a random sample. Community A is maximally even, with each of the 20 species comprising 5% of the total abundance. In this assemblage, the two samples of 20 individual trees yielded 15 and 13 species, respectively. Community B is highly uneven, with one species (the open circle) representing 81% of the total abundance, and the remaining 19 species contributing only 1% each. In this assemblage, the two samples of 20 individual trees yielded only three and four species, respectively.
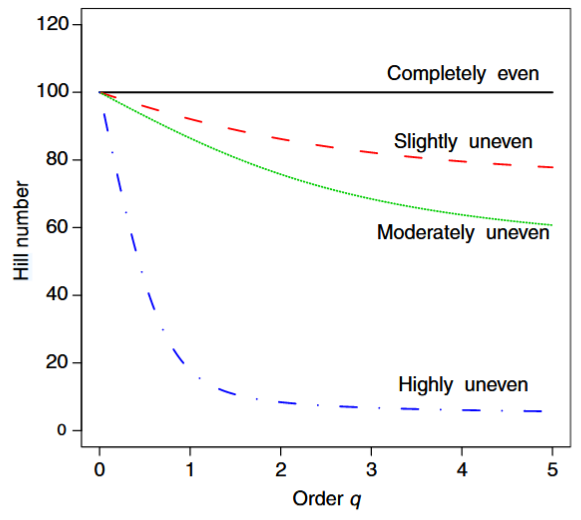
Gotelli & Chao (2013) - Fig. 6 Diversity profile for assemblages of differing evenness.
The x-axis is the order q in the Hill number (eqn [23a]), and is illustrated for values of q from 0 to 5. The y-axis is the calculated Hill number (the equivalent number of equally abundant species). Each of the four assemblages has exactly 100 species and 500 individuals, but they differ in their relative evenness: (1) completely even assemblage (black solid line): each species is represented by five individuals; (2) slightly uneven assemblage (red dashed line): 50 species each represented by seven individuals and 50 species each represented by three individuals (this structure is denoted as {50 x 7, 50 x 3}); (3) moderately uneven assemblage (green dotted line): {22 x 10, 28 x 5, 40 x 3, 10 x 2}; (4) highly uneven assemblage (blue dash–dot line): {1 x 120, 1 x 80, 1 x 70, 1 x 50, 3 x 20, 3 x 10, 90 x 1}. For q=0, the Hill number is species richness, which is equal to 100 for all assemblages. Because Hill numbers represent the equivalent number of equally abundant species, the curve for the perfectly even assemblage (black solid line) does not change as q is increased. Larger values of q place progressively more weight on common species, so the equivalent number of equally abundant species is much lower for the more uneven assemblages than for more even assemblages.
Abundance, species richness, and diversity
Species accumulation and rarefaction curves
Using vegan to calculate alpha diversity metrics within the tidyverse in R (CC196)
Species abundance tools in Genstat
Species Diversity and Species Richness
Field Ecology - Diversity Metrics in R
Generating a rarefaction curve from collector’s curves in R within the tidyverse (CC198)
Community structure and diversity
iNext Online
Software for interpolation and extrapolation of species diversity.
Chao, A., Ma, K. H., & Hsieh, T. C. (2016). iNEXT Online: Software for Interpolation and Extrapolation of Species Diversity. Program and User’s Guide published at http://chao.stat.nthu.edu.tw/wordpress/software_download/inextonline/
Visualizing Biodiversity in [U.S.] National Parks
‘Biodiversity in National Parks is an app that let you visualize Kaggle’s biodiversity dataset. By using the National Park Service database of animal and plant species, the application offers a graphical representation of the data with maps and charts’
Benedetti, A. (2024). Visualizing Biodiversity in [U.S.] National Parks. https://shiny.posit.co/r/gallery/life-sciences/biodiversity-national-parks
Type |
Name |
Note |
URL |
Reference |
|---|---|---|---|---|
R package |
Chapter 9 Community composition |
https://bookdown.org/c_w_beirne/wildCo-Data-Analysis/composition.html#estimated-richnes |
WildCo Lab (2021b). WildCo: Reproducible camera trap data exploration and analysis examples in R. University of British Columbia. https://bookdown.org/c_w_beirne/wildCo-Data-Analysis/#what-this-guide-is |
|
R package |
R package “vegan |
Oksanen, J., Simpson, G. L., Blanchet, F. G., Kindt, R., Legendre, P., Minchin, P. R., O’Hara, R. B., Solymos, P., Stevens, M. H. H., Szoecs, E., Wagner, H., Barbour, M., Bedward, M., Bolker, B., Borcard, D., Carvalho, G., Chirico, M., De Caceres, M., Durand, S., … Weedon, J. (2024). vegan: Community Ecology Package. R package Version 2.6-6.1. <https://doi.org/10.32614/CRAN.package.vegan |
||
Program |
EstimateS |
Dedicated software for estimating diversity, using asymptotic or rarefaction methods. Mac version available |
Colwell, R. K. (2022). EstimateS: Statistical Estimation of Species Richness and Shared Species from Samples. Version 9.1. https://www.robertkcolwell.org/pages/1407 |
|
R package |
Package ‘iNEXT’ - Interpolation and Extrapolation for Species Diversity |
The iNext package (INterpolation and EXTrapolation of species richness) - is both easy to use and rapid to compute. It also comes with a wealth of plotting functions - see the iNext Quick Introduction for a great walk through tutorial. Its core functionality is based on: Chao, Anne, et al. “Rarefaction and extrapolation with Hill numbers: a framework for sampling and estimation in species diversity studies.” Ecological monographs 84.1 (2014): 45-67. |
Chao, A., Ma, K. H., & Hsieh, T. C. (2016). iNEXT Online: Software for Interpolation and Extrapolation of Species Diversity. Program and User’s Guide published at http://chao.stat.nthu.edu.tw/wordpress/software_download/inextonline/ |
|
Exercise/Tutorial |
2.2: Measuring Species Diversity |
Easy to interpet explanation of species richness vs evenness, species area curves, rarefaction, and how to calculate diversity |
Gerhart-Barley, L., M. (n.d.). 2.2: Measuring Species Diversity https://bio.libretexts.org/Courses/University_of_California_Davis/BIS_2B%3A_Introduction_to_Biology_-_Ecology_and_Evolution/02%3A_Biodiversity/2.02%3A_Measuring_Species_Diversity |
|
R package / Tutorial |
Species Accumulation Curves with vegan, BiodiversityR and ggplot2 |
Software for interpolation and extrapolation of species diversity |
Roeland Kindt, R. (2020). Species Accumulation Curves with vegan, BiodiversityR and ggplot2. https://rpubs.com/Roeland-KINDT/694021 |
Ahumada, J. A., Silva, C. E. F., Gajapersad, K., Hallam, C., Hurtado, J., Martin, E., McWilliam, A., Mugerwa, B., O’Brien, T., Rovero, F., Sheil, D., Spironello, W. R., Winarni, N., & Andelman, S. J. (2011). Community Structure and Diversity of Tropical Forest Mammals: Data from a Global Camera Trap Network. Philosophical Transactions: Biological Sciences, 366(1578), 2703-2711. https://doi.org/10.1098/rstb.2011.0115
Baylor Tutoring Center. (2021, July 31). Species Diversity and Species Richness [Video]. YouTube. https://www.youtube.com/watch?v=UXJ0r4hjbqI
Benedetti, A. (2024). Visualizing Biodiversity in [U.S.] National Parks. https://shiny.posit.co/r/gallery/life-sciences/biodiversity-national-parks
Bioninja (N.D.). “Biodiversity.” https://old-ib.bioninja.com.au/options/option-c-ecology-and-conser/c4-conservation-of-biodiver/biodiversity.html
Brodie, J. F., Giordano, A. J., Zipkin, E. F., Bernard, H., Mohd‐Azlan, J., & Ambu, L. (2015). Correlation and persistence of hunting and logging impacts on tropical rainforest mammals. Conservation Biology, 29(1), 110-121. https://doi.org/10.1111/cobi.12389
Chatterjee, N., Schuttler, T. G., Nigam, P., & Habib, B. (2021). Deciphering the rarity-detectability continuum: optimizing Survey design for terrestrial mammalian community. Ecosphere 12(9), e03748. https://doi.org/10.1002/ecs2.3748
Chao, A., Ma, K. H., & Hsieh, T. C. (2016). iNEXT Online: Software for Interpolation and Extrapolation of Species Diversity. Program and User’s Guide published at http://chao.stat.nthu.edu.tw/wordpress/software_download/inextonline/
Chao, A., Gotelli, N.J., Hsieh, T. C., Sander, E. L., Ma, K. H., Colwell, R. K. & Ellison, A. M. (2014). Rarefaction and extrapolation with Hill numbers: a framework for sampling and estimation in species diversity studies. Ecological Monographs, 84, 45-67. https://doi.org/10.1890/13-0133.1
Colwell, R. K. (2022). EstimateS: Statistical Estimation of Species Richness and Shared Species from Samples. Version 9.1. https://www.robertkcolwell.org/pages/1407
Gerhart-Barley, L., M. (n.d.). 2.2: Measuring Species Diversity https://bio.libretexts.org/Courses/University_of_California_Davis/BIS_2B%3A_Introduction_to_Biology_-_Ecology_and_Evolution/02%3A_Biodiversity/2.02%3A_Measuring_Species_Diversity
Gotelli, N. J., & Chao, A. (2013). Measuring and Estimating Species Richness, Species Diversity, and Biotic Similarity from Sampling Data. In Encyclopedia of Biodiversity (pp. 195-211). Elsevier. https://doi.org/10.1016/B978-0-12-384719-5.00424-X
Hsieh, T. C., Ma, K. H., & Chao, A. (2015). iNEXT: Interpolation and Extrapolation for Species Diversity. R package Version 2.6-6.1. https://doi.org/10.32614/CRAN.package.iNEXT
Iknayan, K. J., Tingley, M. W., Furnas, B. J., & Beissinger, S. R. (2014). Detecting Diversity: Emerging Methods to Estimate Species Diversity. Trends in Ecology & Evolution, 29(2), 97-106. https://doi.org/10.1016/j.tree.2013.10.012
Kinnaird, M. F., & O’Brien, T. G. (2011). Density estimation of sympatric carnivores using spatially explicit capture-recapture methods and standard trapping grid. Ecological Applications, 21(8), 2908-2916. https://www.jstor.org/stable/41417102
Kitamura, S., Thong-Aree, S., Madsri, S., & Poonswad, P. (2010). Mammal diversity and conservation in a small isolated forest of southern Thailand. Raffles Bulletin of Zoology, 58(1), 145-156. https://www.pangolinsg.org/wp-content/uploads/sites/4/2018/06/Kitamura-et-al._2010_Mammal-diversity-in-small-forest-of-Southern-Thailand.pdf
Loreau, M. (2010). Estimating Species Richness Using Species Accumulation and Rarefaction Curves. In O. Kinne (Ed.), The Challenges of Biodiversity Science (17th ed., Vol. 1, pp. 20-21). International Ecology Institute. https://www.researchgate.net/publication/285953769_The_challenges_of_biodiversity_science
MacKenzie, D. I., Nichols, J. D., Royle, J. A., Pollock, K. H., Bailey, L. L., & Hines, J. E. (2006). Occupancy Estimation and Modeling: Inferring Patterns and Dynamics of Species Occurrence. Academic Press, USA. https://www.sciencedirect.com/book/9780124071971/occupancy-estimation-and-modeling
mecks100 (2018, Feb 7). Species accumulation and rarefaction curves [Video]. YouTube. https://www.youtube.com/watch?v=4gcmAUpo9TU
O’Connor, K. M., Nathan, L. R., Liberati, M. R., Tingley, M. W., Vokoun, J. C., & Rittenhouse, T. A. G. (2017). Camera trap arrays improve detection probability of wildlife: Investigating study design considerations using an empirical dataset. PloS One, 12(4), e0175684. https://doi.org/10.1371/journal.pone.0175684
Oksanen, J., Simpson, G. L., Blanchet, F. G., Kindt, R., Legendre, P., Minchin, P. R., O’Hara, R. B., Solymos, P., Stevens, M. H. H., Szoecs, E., Wagner, H., Barbour, M., Bedward, M., Bolker, B., Borcard, D., Carvalho, G., Chirico, M., De Caceres, M., Durand, S., … Weedon, J. (2024). vegan: Community Ecology Package. R package Version 2.6-6.1. <https://doi.org/10.32614/CRAN.package.vegan
Pettorelli, N., Lobora, A. L., Msuha, M. J., Foley, C., & Durant, S. M. (2010). Carnivore biodiversity in Tanzania: Revealing the distribution patterns of secretive mammals using camera traps. Animal Conservation, 13(2), 131-139. https://doi.org/10.1111/j.1469-1795.2009.00309.x
Project Dragonfly. (2019, Jan 24). Abundance, species richness, and diversity [Video]. YouTube. https://www.youtube.com/watch?v=ghhZClDRK_g&source_ve_path=OTY3MTQbqI
Pyron, M. (2010) Characterizing Communities. Nature Education Knowledge, 3(10):39. https://www.nature.com/scitable/knowledge/library/characterizing-communities-13241173/
Riffomonas Project (2022a, Mar 17). Using vegan to calculate alpha diversity metrics within the tidyverse in R (CC196) [Video]. YouTube. https://www.youtube.com/watch?v=wq1SXGQYgCs
Riffomonas Project (2022b, Mar 24). Generating a rarefaction curve from collector’s curves in R within the tidyverse (CC198) [Video]. YouTube. https://www.youtube.com/watch?v=ywHVb0Q-qsM
Samejima, H., Ong, R., Lagan, P. & Kitayama, K. (2012). Camera-trapping rates of mammals and birds in a Bornean tropical rainforest under sustainable forest management. Forest Ecology and Management, 270, 248-256. https://doi.org/10.1016/j.foreco.2012.01.013
Si, X., Kays, R., & Ding, P. (2014). How long is enough to detect terrestrial animals? Estimating the minimum trapping effort on camera traps. PeerJ, 2, e374. https://doi.org/10.7717/peerj.374
Styring, A. (2020a, May 4). Field Ecology - Diversity Metrics in R. [Video]. YouTube. https://www.youtube.com/watch?v=KBByV3kR3IA
Styring, A. (2020b, Jun 22). Generating a species accumulation plot in excel for BBS data. [Video]. YouTube. https://www.youtube.com/watch?reload=9&app=desktop&v=OEWdPm3zg9I
Tobler, M. W., Pitman, R. L., Mares, R. & Powell, G. (2008). An Evaluation of Camera Traps for Inventorying Large- and Medium-Sized Terrestrial Rainforest Mammals. Animal Conservation, 11, 169-178. https://doi.org/10.1111/j.1469-1795.2008.00169.x
VSN International (2022, Jul 13). Species abundance tools in Genstat [Video]. YouTube. https://www.youtube.com/watch?v=wBx7f4PP8RE
Wearn, O. R., Carbone, C., Rowcliffe, J. M., Bernard, H. & Ewers, R. M. (2016). Grain-dependent responses of mammalian diversity to land-use and the implications for conservation set-aside. Ecological Applications, 26(5), 1409-1420. https://doi.org/10.1890/15-1363
Wearn, O. R., & Glover-Kapfer, P. (2017). Camera-Trapping for Conservation: A Guide to Best-ractices. WWF conservation technology series, 1, 1-181. http://dx.doi.org/10.13140/RG.2.2.23409.17767
WildCo Lab (2021b). WildCo: Reproducible camera trap data exploration and analysis examples in R. University of British Columbia. https://bookdown.org/c_w_beirne/wildCo-Data-Analysis/#what-this-guide-is
Yue, S., Brodie, J. F., Zipkin, E. F., & Bernard, H. (2015). Oil palm plantations fail to support mammal diversity. Ecological Applications, 25(8), 2285-2292. https://doi.org/10.1890/14-1928.1