Time in front of the camera (TIFC)#
Hint
Assumptions, Pros, Cons
Camera locations are randomly placed or representative relative to animal movement (Becker et al., 2022)
Movement is unaffected by the cameras (Becker et al., 2022)
Reliable detection of animals in part of the camera’s FOV (at least) (Becker et al., 2022)
Does not require individual identification (Warbington & Boyce, 2020)
Makes no assumptions about home range (Warbington & Boyce, 2020)
Comparable to estimates from SECR (Efford, 2004; Borchers & Efford, 2008; Royle & Young, 2008; Royle et al., 2009) (Warbington & Boyce, 2020)
Requires careful calculation of the effective area of detection (Warbington & Boyce, 2020)
A high level of measurement error (Becker et al., 2022)
This section will be available soon! In the meantime, check out the information in the other tabs!
In-depth
Note
This content was adapted from: The Density Handbook, “Using Camera Traps to Estimate Medium and Large Mammal Density: Comparison of Methods and Recommendations for Wildlife Managers” (Clarke et al., 2023)
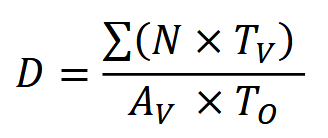
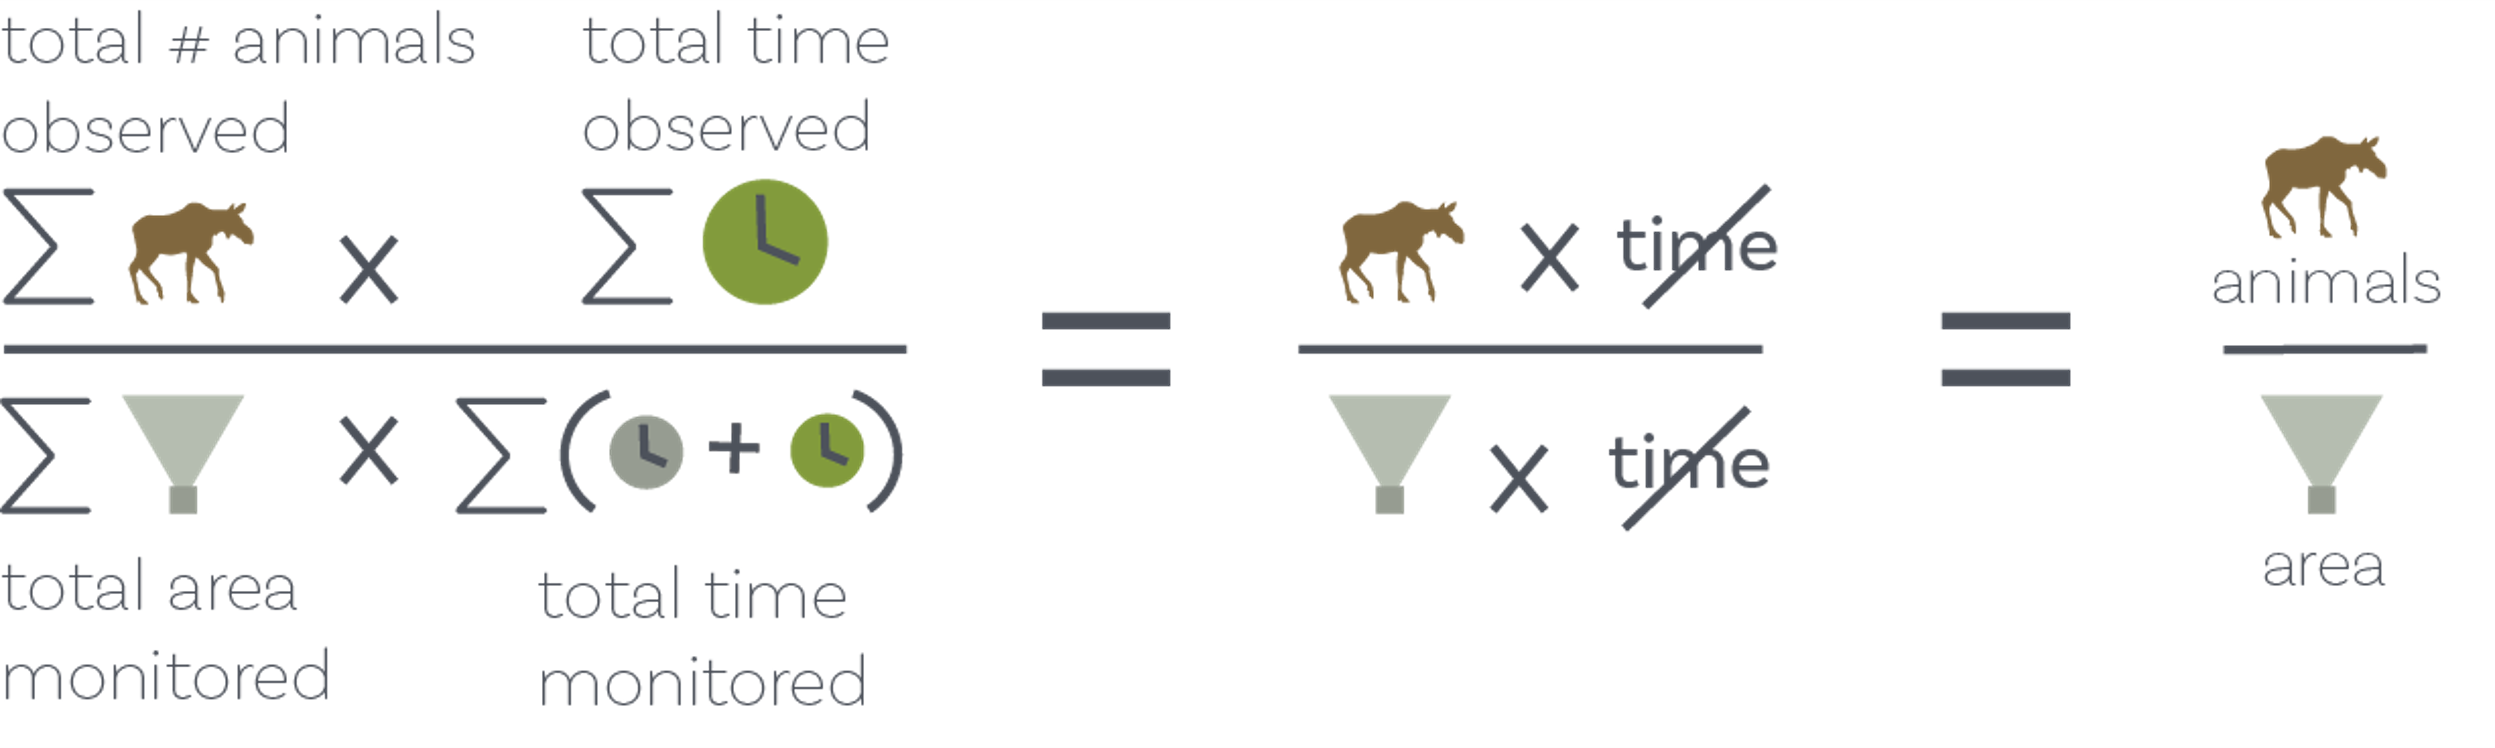
The time in front of the camera (TIFC) model is based on quadrat sampling. Typically, quadrats are used to sample slow- or non-moving organisms at a moment in time; as a simple example, a researcher lays a quadrat on the ground, counts the number of mussels in it and divides the count by the quadrat area. TIFC treats the camera viewshed like a vertical quadrat (Becker et al., 2022; Dickie, 2022). Unlike a conventional quadrat, however, the camera viewshed samples highly mobile organisms in a relatively small sliver of space and over long periods time (Becker et al., 2022; Dickie, 2022). The count of animals in the camera viewshed “quadrat,” then, can be thought of in “animal time” and the area covered by the quadrat in “area-time,” such that:
Clarke et al. (2023) - Fig. 8 A) Still from 中島啓裕’s (2021) video series. Example of overlaying a video recording of an animal on a reference image of the focal area (faint triangle) to determine staying time T. B) Still from Appendix S2 from Palencia et al. (2021). Example of superimposing the focal area on an image capture.
where the numerator, animal-time, is the number of animals N multiplied by the time those animals spend in the viewshed TO, summed over all detections; and the denominator, area-time, is the area of the viewshed AV multiplied by the total camera operating time TO (Becker et al., 2022). Using this equation, density must be calculated for each species at each camera station, then averaged across the camera network.
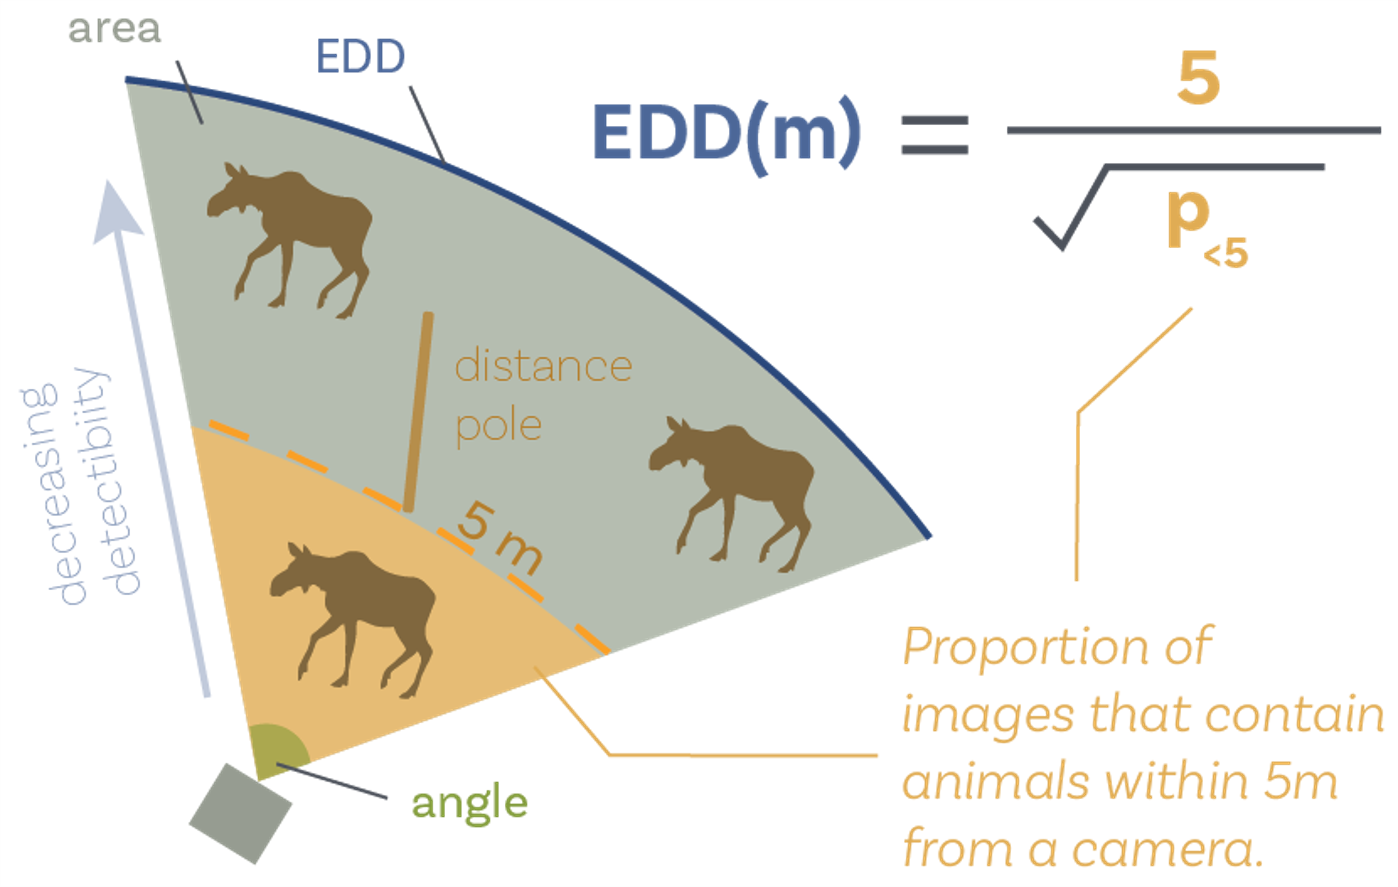
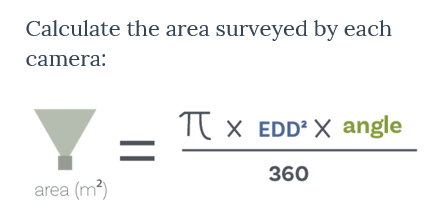
To calculate AV: in the field, markers (e.g., poles) must be placed at known distances from the camera to divide the viewshed into distance bins; during analysis, the proportion of detections in each bin is determined (Becker et al., 2022). The camera angle of view – which varies with make and model – is also needed to solve for AV. In most cases, TO will be the time from initial camera deployment to final camera collection (Becker et al., 2022). In case of displacement, damage or failure, cameras should be programmed to take time-lapse images, so end-of-operation time can be traced back to a specific day or hour (Becker et al., 2022).
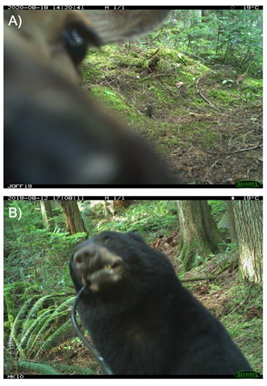
Clarke et al. (2023) - Fig. 9 Examples of behaviours that increase time in the viewshed (𝑇~𝑣~). A) A mule deer inspects a camera trap. © Cole Burton, Wildlife Coexistence Lab. B) A black bear pulls on the lock securing a camera trap to a tree. © Michael Procko, Wildlife Coexistence Lab.
Simulations and Field Experiments (Clarke et al., 2023)
The TIFC model has been field-tested on several different species. For moose, TIFC produced similar density estimates as aerial distance sampling (DS) after TIFC-derived estimates were corrected for the time animals spent investigating equipment (camera and 5 m pole; {{ rtxt_becker_et_al_2022 }})). This study used image data collected in Alberta at 2,990 camera stations over the course of 6 years; despite the large sample size and long study duration, estimates were not very precise.A study of five ungulate species (moose, bison, elk, mule and white-tailed deer) in two enclosed parks in Alberta found that TIFC- and aerial survey-derived density estimates were similar for moose and bison, but that TIFC significantly overestimated elk density compared with aerial surveys (Foca, 2021). Two potential reasons for the discrepancy in elk density are: 1) that aerial surveys underestimated density, since elk in the study area occupy forested habitats, do not form large herds during the survey period, and estimates were not corrected for sightability; and 2) cameras may have been disproportionately set in areas elk prefer (Foca, 2021). Group travelling behaviour may also have affected elk TIFC estimates, since detection probability and time in the viewshed (TV) can change with group size (Foca, 2021). Estimates of mule and white-tailed deer densities could not be compared with aerial survey results, since deer are not surveyed by air in this area. Foca’s (2021) TIFC analyses produced the first density estimates for deer in both parks.
In Uganda, TIFC-derived estimates of antelope were comparable to results from camera trap spatial capture-recapture (SCR; Brownlee et al., 2022; Warbington & Boyce, 2020). The model performed inconsistently for black bears, caribou, white-tailed deer and other species, however, compared to camera-based spatial count (SC), DNA markre capture and aerial survey methods (Fisher et al. in review).
Visual resources
Clarke et al. (2023) - Fig. 8 A) Still from 中島啓裕’s (2021) video series. Example of overlaying a video recording of an animal on a reference image of the focal area (faint triangle) to determine staying time T. B) Still from Appendix S2 from Palencia et al. (2021). Example of superimposing the focal area on an image capture.
Clarke et al. (2023) - Fig. 9 Examples of behaviours that increase time in the viewshed (𝑇~𝑣~). A) A mule deer inspects a camera trap. © Cole Burton, Wildlife Coexistence Lab. B) A black bear pulls on the lock securing a camera trap to a tree. © Michael Procko, Wildlife Coexistence Lab.
How to estimate density using TIFC; Video clip from presentation titled “Comparisons between moose densities with aerial surveys and integrated camera projects”
Shiny apps/Widgets
Check back in the future!
Analytical tools & Resources
Type |
Name |
Note |
URL |
Reference |
|---|---|---|---|---|
Tutorial |
Estimating animal density using TIFC (Time In Front of Camera) |
Created by author of TIFC method. |
Becker, M. Huggard, D. J., & Alberta Biodiversity Monitoring Institute [ABMI]. (2021).Estimating animal density using TIFC (Time In Front of Camera). https://github.com/mabecker89/tifc-method |
|
R package |
abmi.camera.extras |
Becker, M. Huggard, D. J., & Alberta Biodiversity Monitoring Institute [ABMI]. (2020). abmi.camera.extras. R package version 0.0.1. https://mabecker89.github.io/abmi.camera.extras |
||
Tutorial |
abmi.camera.extras: Animal Density from Camera Data |
Main resource page https://mabecker89.github.io/abmi.camera.extras/index.html includes: |
Becker, M. Huggard, D. J., & Alberta Biodiversity Monitoring Institute [ABMI]. (2020). abmi.camera.extras. R package version 0.0.1. https://mabecker89.github.io/abmi.camera.extras |
|
Article |
One size does not fit all: A novel approach for determining the Realised Viewshed Size for remote camera traps. |
Carswell, B. M., Avgar, T., Street, G. M., Boyle, S. P., & Vander Wal, E. (2024). One size does not fit all: A novel approach for determining the Realised Viewshed Size for remote camera traps. Ecology. https://doi.org/10.1101/2024.05.09.593241 |
References